COPYRIGHT © 2016-2017 by Michael Herman, Seattle, Washington and Toronto, Canada. All rights reserved.
Michael Herman is an expert when it comes to the mathematical modeling, analysis, and visualization of almost everything:
- Large enterprise organizations,
- Commercial, global-scale, cloud services platforms,
- Organization principles and belief systems,
- Human platforms,
- Aircraft engines, and
- Muscle cars.
Michael is the inventor of the #Graphitization Continous Transformation Model – a closed-closed loop feedback process for the ingestion, modeling, analysis, visualization, systems optimization, and life cycle management of any type of strategy, system, asset, architecture, or process.

Figure 1. #Graphitization Continuous Transformation Model
A key concept of #Graphitization is the implementation of Transformative Changes that result in positive increases in business value in the system being modeled.
#Graphitization
What is #Graphitization?
#Graphitization is a data science and enterprise architecture framework and process model for modeling, ingesting, organizing, analyzing, and visualizing any domain of endeavor by using graphs – networks of connected objects and relationships with each object and relationship annotated with additional descriptive information (metadata).
The primary applications of #Graphitization are:
- System optimization,
- Systems life cycle management, and
- Transformative Change in resulting in positive increases in business value for the system being studied.
A system is defined as any collection of strategies, system components, assets, architectures or processes.
References
- #Graphitization of the Enterprise
- Isomorphic Weighted Graph Databases and Graph Algorithm Non-Collinearity [Work-In-Progress]
#Graphitization Continuous Transformation Model
The #Graphitization general model is described in Figure 2. as it applies to the design and optimization of large enterprise organizations.
Figure 2. #Graphization Continuous Transformation Model: Large Enterprise Organizations
The same model can also be used to improve the design and operation of many different types of systems:
- Large scale enterprise organizations (public and private sector)
- Aircraft engines, muscle cars, and other high-performance engine systems
- Commercial, global-scale, cloud services platforms
- Automated service composition of cloud services-based data systems
- Large collaborative ecosystems: employee groups, business partners, social networks
- Large ecosystems of competing or competitive business organizations
- Organization principles and belief systems
- Conventions software applications and architectures: desktop, server, and web apps
- International standards for visual modeling languages
- Parallelspace ModelMate
- Enterprise Data Management
- Internet of Things (IoT)
- Architecture Reference Models
Standards
NEO Enhancement Proposal (NEP) Standards Author
- Principal author: NEP-10 Composite Smart Contracts
“This NEP proposes a solution to the scenarios where a smart contract supports extensions to an existing standard. Conforming to this NEP involves implementing a single required, constant-valued operation and method `supportedStandards`, and possibly creating one or more new NEPs to define any new, required set(s) of required operations and methods.”
Reference: https://github.com/neo-project/proposals/blob/master/nep-10.mediawiki
Projects and Publications
0. SerentityData Graph
Model-based off-chain and on-chain (blockchain) graph data creation, migration, visualization, and analysis
Abstract
SerentityData Graph is an entity-relationship modeling, serialization, and graph analysis solution that supports development of traditional full-stack and blockchain smart contract applications. SerentityData features tight Neo4j integration for on-chain & off-chain graph data visualization and analysis.
Description
SerentityData Graph is an open source, entity-relationship modeling, serialization, and graph data visualization and analysis solution that supports the development of traditional full-stack, blockchain-based smart contract, and Neo4j graph database applications.
Starting from a single data model, SerentityData supports the automatic code generation of entities and relationships that support symmetric development of: (a) off-chain data in traditional multi-tier full-stack applications, (b) on-chain data management for blockchain-based distributed ledger technology apps (dApps), and (c) Neo4j enterprise graph applications.
SerentityData features complete life-cycle integration with Neo4j for on-chain and off-chain graph data creation, migration, visualization, and analysis. Live code walk-throughs and demonstrations will enable you to begin using SerenityData and Neo4j immediately. Github: https://github.com/mwherman2000/serentitydata-compiler
Resources
My blog: https://hyperonomy.com/
Related blog posts
- Michael Herman, Blockchain Developer, Enterprise Architect and Data Scientist: #Graphitization Inventor https://hyperonomy.com/2017/05/18/michael-herman-inventor-of-graphitization/
- #Graphitization of the Enterprise https://hyperonomy.com/2017/01/02/graphitization-of-the-enterprise/
- Tokenize Every Little Thing (ELT) https://hyperonomy.com/2018/01/24/tokenization-of-every-little-thing-elt/
- #Graphitization of .NET Applications: Marrying Open EA Data with Graph Databases https://hyperonomy.com/2016/10/19/crossing-the-ea-chasm-marrying-open-ea-data-with-graph-databases/
- #Graphitization of Ray Dalio’s Principles: Iteration 1 https://hyperonomy.com/2016/12/29/graphitization-of-ray-dalios-principles/
- #Graphitization of Ray Dalio’s Principles: Iteration 2 https://hyperonomy.com/2016/12/30/graphitization-of-ray-dalios-principles-iteration-2/
- Crossing the EA Chasm: #Graphitization of ArchiMate 3.0 – Iteration 1 https://hyperonomy.com/2017/01/17/crossing-the-ea-chasm-graphitization-of-archimate-3-0/
- Crossing the EA Chasm: #Graphitization of ArchiMate 3.0 – Iteration 2 https://hyperonomy.com/2017/02/08/crossing-the-ea-chasm-graphitization-of-archimate-3-0-iteration-2/
- Crossing the EA Chasm: Automating Enterprise Architecture Modeling #1 https://hyperonomy.com/2016/10/22/crossing-the-ea-chasm-automating-enterprise-architecture-modeling/
- Crossing the EA Chasm: Automating Enterprise Architecture Modeling #2 https://hyperonomy.com/2016/11/04/crossing-the-ea-chasm-automating-enterprise-architecture-modeling-2/
- Crossing the EA Chasm: ArchiMate “Keep Calm and Have IT Your Way” https://hyperonomy.com/2016/11/17/crossing-the-ea-chasm-archimate-have-it-your-way/
- Crossing the EA Chasm: Open Repository Strategies for Enterprise Architecture https://hyperonomy.com/2016/10/04/the-ea-chasm-open-repository-strategies-for-enterprise-architecture/
- Crossing the EA Chasm: Enterprise Architecture Diagrams Your Grandmother (and CIO) Will Love https://hyperonomy.com/2016/10/13/archimate-diagrams-your-grandmother-and-cio-will-love/
- #Graphitization of ArchiMate: Getting MMOR from ArchiMate using the ModelMate Master Online Repository https://hyperonomy.com/2017/02/10/crossing-the-ea-chasm-how-to-use-the-modelmate-online-repository-mmor/
- #Graphitization of the Amazon Leadership Principles (introducing Personal Leadership Principle Maps) – Iteration 1 https://hyperonomy.com/2017/05/08/amazons-principles/
- What are the differences between improving the design (and operation) of an aircraft engine, a muscle car, a large enterprise, and/or an integrated commercial global cloud services platform …all running at hyperscale? https://hyperonomy.com/2017/04/10/whats-the-difference-between-improving-the-design-and-operation-of-an-aircraft-engine-a-muscle-car-a-large-enterprise-and-a-commercial-global-cloud-services-platform/
Live Neo4j Models
- http://hobby-icgaeohcoeaggbkeabhldpol.dbs.graphenedb.com:24789/browser/ Userid: ModelMate_Master_Datasets10 Password: YqeZAH4ODEJqglkEsK5p
YouTube Channel: https://www.youtube.com/playlist?list=PLU-rWqHm5p46bIDXPNf4c2JP_AOkopnV5
- 12. NEO Persistable Classes (NPC) Platform 2.1: Preview https://www.youtube.com/watch?v=N-jiJOZwiFg&list=PLU-rWqHm5p46bIDXPNf4c2JP_AOkopnV5&index=5
- NEO Persistable Classes (NPC) Platform 2.0: Deep Dive https://www.youtube.com/watch?v=Nj4-m2o94VE&list=PLU-rWqHm5p46bIDXPNf4c2JP_AOkopnV5&index=6
- NEO Persistable Classes 1.0: Deep Dive (Video 2 of 3) [Update 1] https://www.youtube.com/watch?v=qwteL1BiCjM&list=PLU-rWqHm5p46bIDXPNf4c2JP_AOkopnV5&index=7
- NEO Persistable Classes Platform 2.2: Structured Storage & Reusable, Indexed, Non-Fungible Entities https://www.youtube.com/watch?v=vnAxyCAZ1ec&list=PLU-rWqHm5p46bIDXPNf4c2JP_AOkopnV5&index=10
Related Github Projects
- SerentityData Entity Compiler (serentitydata-compiler) https://github.com/mwherman2000/serentitydata-compiler/blob/master/README.md
- NEO Persistable Classes (NPC) Compiler 2.1 (npcc) – Compiler for the NEO Persistable Classes (NPC) Platform 2.1 https://github.com/mwherman2000/neo-npcc2
- NEO Persistable Classes V1.0 – An Efficient Object-Oriented Framework for C#.NEO Smart Contract Development (ORIGINAL) – https://github.com/mwherman2000/neo-persistibleclasses
Recognition
- NeoDraw – NEO Persistable Classes Platform 2.0: NEO-Microsoft dApp Competition (4th place prize – USD$15,000) – https://neo.org/blog/details/3074 and https://neo.org/awards.html
Keywords
- blockchain on-chain data modeling symmetric programming data management .NET C# NEO Stratis Ethereum Technical Case Study Developer Best Practices
1. Large scale enterprise organizations (public and private sector)
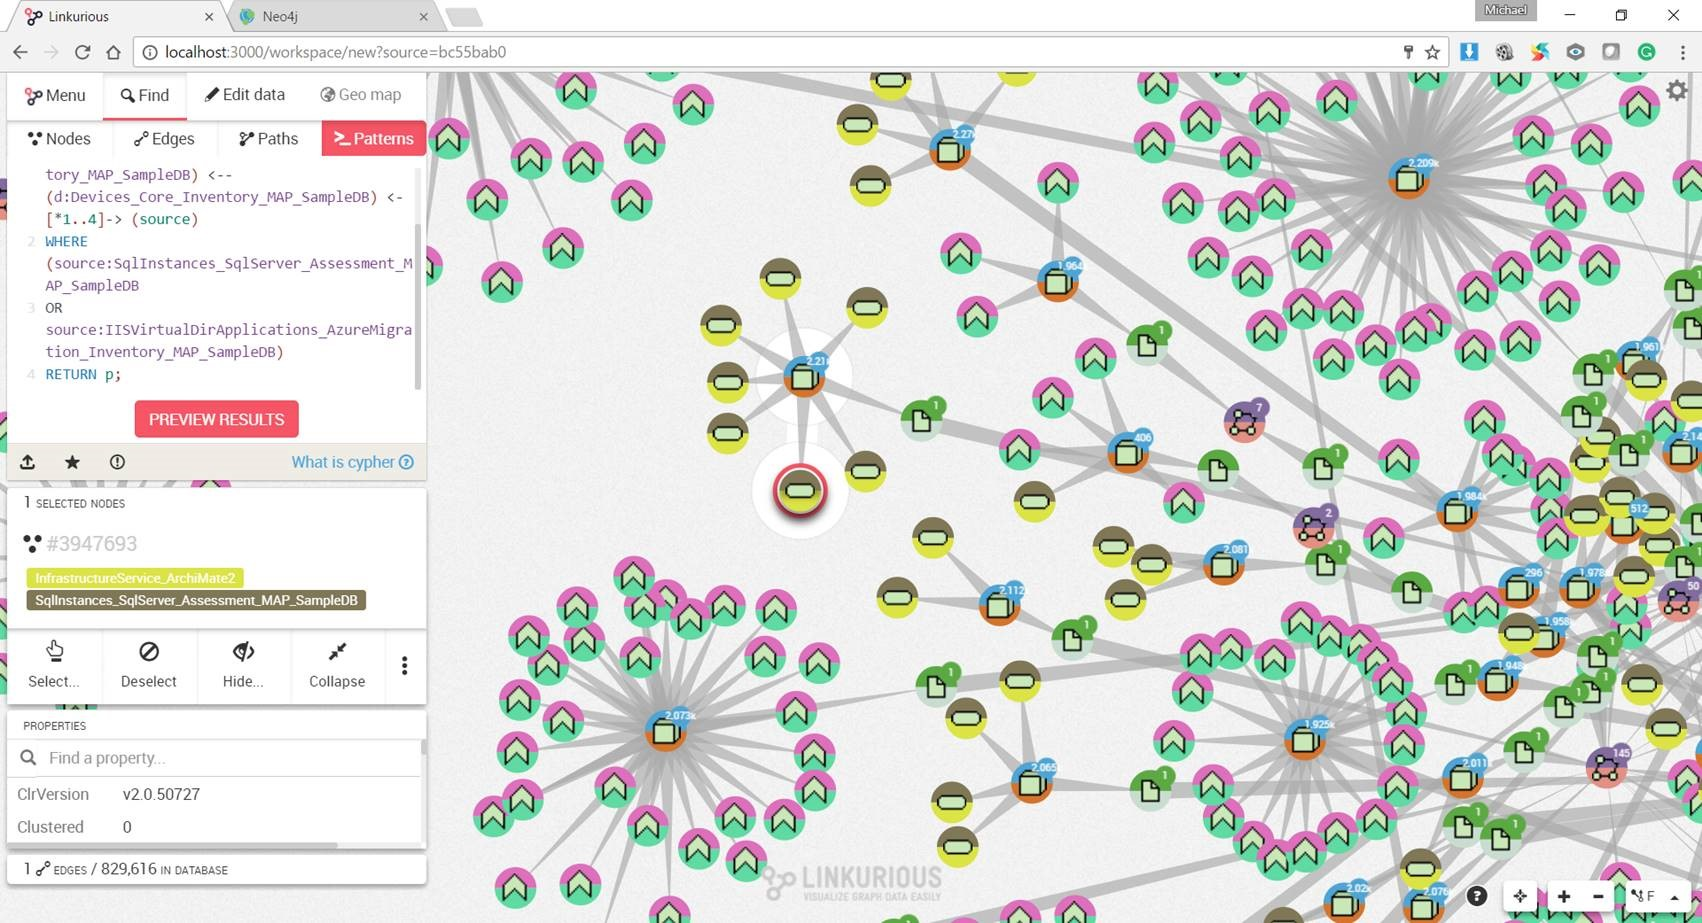
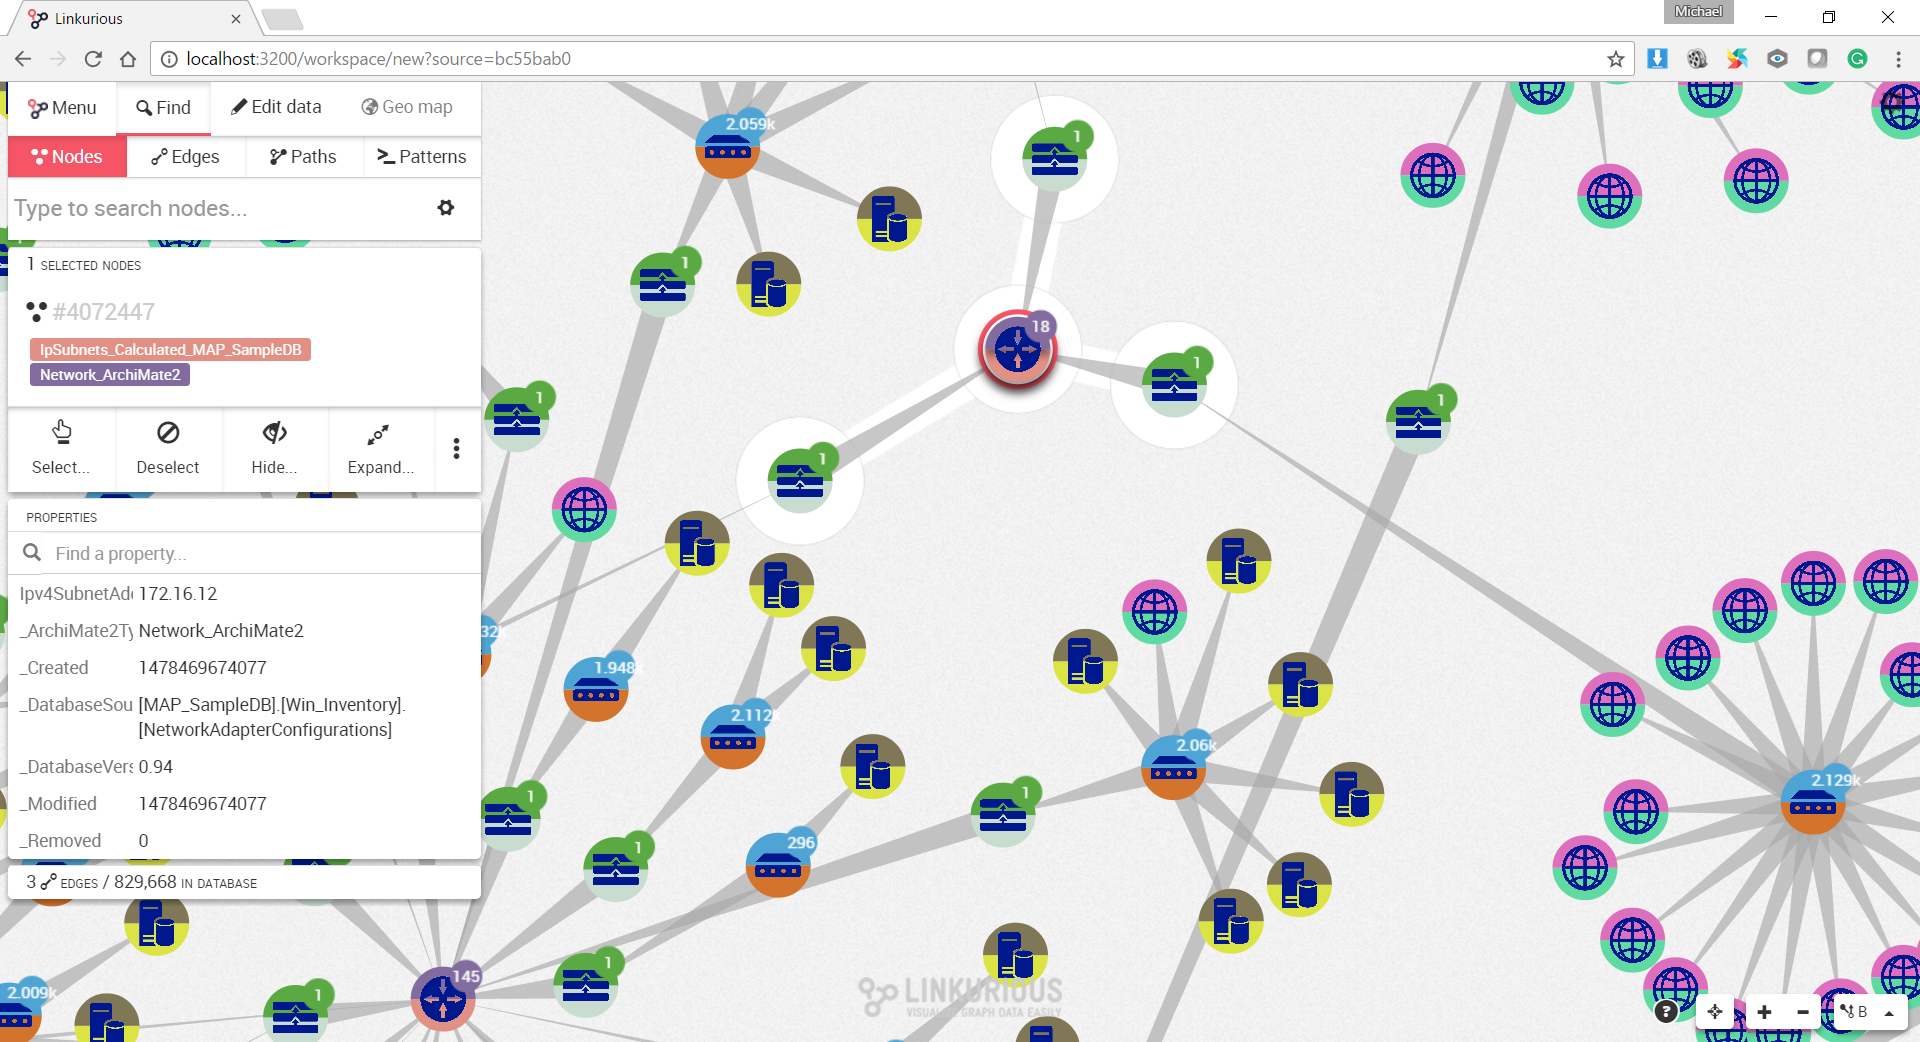
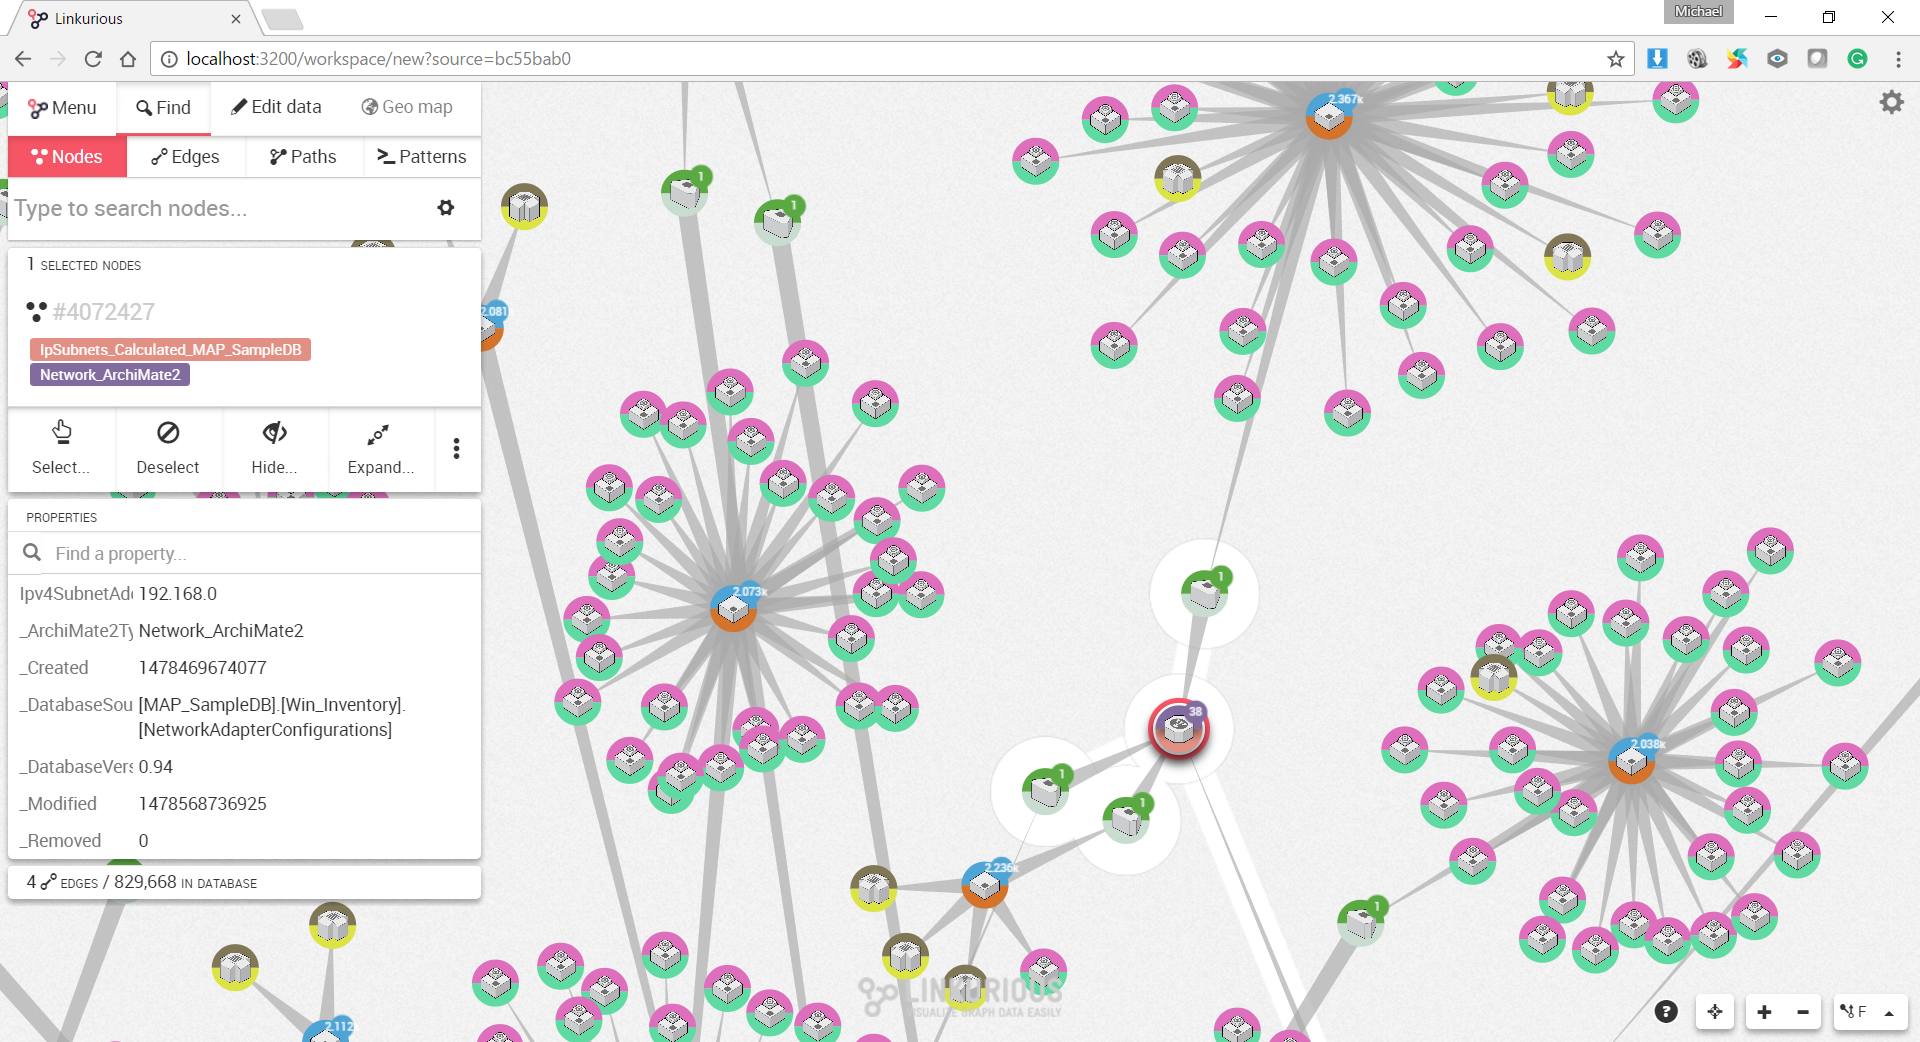
The first applications of #Graphitization were in the field of traditional enterprise architecture modeling and analysis:
- Business Architecture
- Application Architecture
- Technology/Infrastructure Architecture
References
- #Graphitization of the Enterprise
- Crossing the Chasm: Progressive Enterprise Architecture Model (PEAM)
- Progressive Enterprise Architecture Maps – Update 2
- Using ArchiMate 2.1 to Model Product or Service Markets
- ArchiMate 3.0: What is the preferred way to model a Server Farm?
- Crossing the EA Chasm: Enterprise Architecture Diagrams Your Grandmother (and CIO) Will Love
- Crossing the EA Chasm: Annotating Your EA Models with RACI Roles
- Crossing the EA Chasm: Automating Enterprise Architecture Modeling #1
- Crossing the EA Chasm: Automating Enterprise Architecture Modeling #2
- Crossing the Enterprise Architecture Chasm
- ModelMate Architecture Reference Model
- What are the differences between improving the design (and operation) of an aircraft engine, a muscle car, a large enterprise, and/or an integrated commercial global cloud services platform …all running at hyperscale?
- Modeling a Company and Its Locations, Markets, Employees, Investors & Roles: Proposals, Wishes & Dreams
2. Aircraft engines, muscle cars, and other high-performance engine systems
It turns out that the modeling and analysis of any complex system is an ideal candidate for #Graphitization.
References
3. Commercial, global-scale, cloud services platforms
One particularly important application is the modeling and analysis of very large, commercial, global-scale, cloud services platforms.
References
4. Automated service composition of cloud services-based data systems
Call the solution “Expedia for Microsoft Azure/AWS/SFDC/…” or whatever you prefer, today’s commercial cloud services platforms are still a pain in the ass to use for creating non-trivial applications. Left, right, and center you have to hand-code a myriad of worker processes simply to reformat and pass data around.
#Graphitization is an optimal approach for modeling the underlying cloud services platform services catalog.
References
- MS Azure is a bit of a bucket of bolts …very good bolts …but relative to the other IoT vendors, a bucket of bolts.
- What are the differences between improving the design (and operation) of an aircraft engine, a muscle car, a large enterprise, and/or an integrated commercial global cloud services platform …all running at hyperscale?
- Microsoft Azure Stack POC Architecture Reference Model (ARM): ArchiMate Model – version 1-0-7 – April 30, 2016
5. Large collaborative ecosystems: employee groups, business partners, social networks
Project “Boston” is named after some potential business partners and the embryo for the idea coming from my months as a founding Groove Networks business partner (including many of my most important relationships that I still maintain today).
6. Large ecosystems of competing or competitive business organizations
Modeling of large ecosystems of competing/competitive business organizations is a straightforward #Graphitization use case.
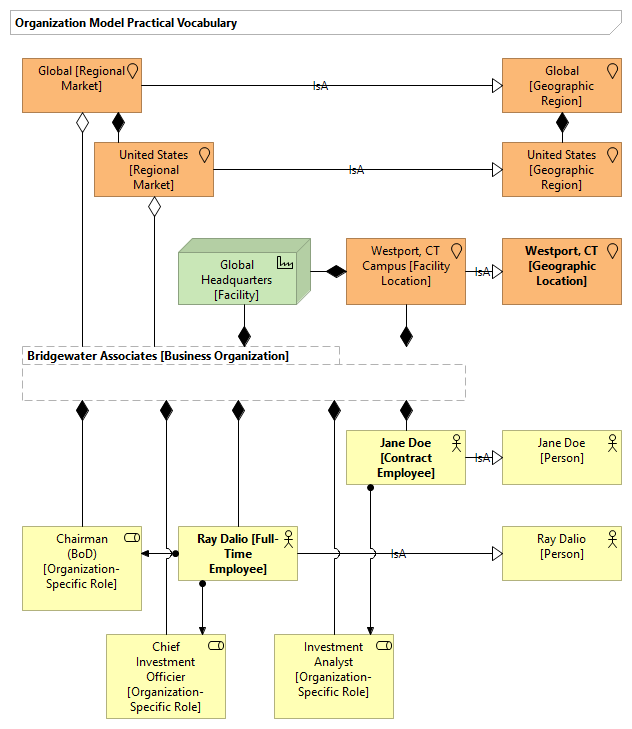
7. Organization principles and belief systems
On the surface, the #Graphitization of principle and belief-based frameworks is pretty straightforward but this is because the basic #Graphitization serves as the substrate for many advanced data ingestion, analysis, and visualization projects.
Below are the results of the #Graphitization of two principle and belief-based frameworks:
- Bridgewater Associates: Ray Dalio’s Principles
- Amazon: Jeff Bezos’ Amazon Leadership Principles
References
- #Graphitization of Ray Dalio’s Principles: Iteration 1
- #Graphitization of Ray Dalio’s Principles: Iteration 2
- #Graphitization of the Amazon Leadership Principles (introducing Personal Leadership Principle Maps) – Iteration 1
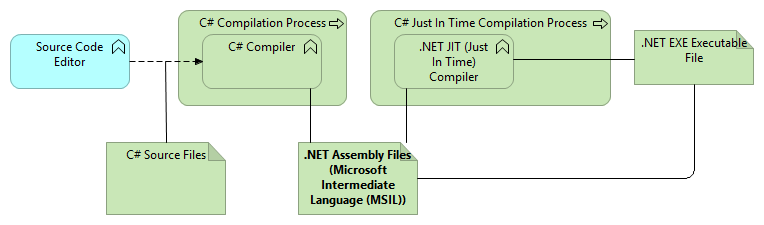
8. Conventional software applications and architectures: desktop, server, and web apps
Modeling of complex, multi-language, multiple runtime software environments is a use case that is an ideal application of #Graphitization.
References
- #Graphitization of .NET Applications: Marrying Open EA Data with Graph Databases
- Pinc-A Tool For Maintaining Configurable Software in Pascal1
- Pinc-A Tool For Maintaining Configurable Software in Pascal2
- Pinc-A Tool For Maintaining Configurable Software in Pascal3
- Pinc-A Tool For Maintaining Configurable Software in Pascal4
- Pinc-A Tool For Maintaining Configurable Software in Pascal5
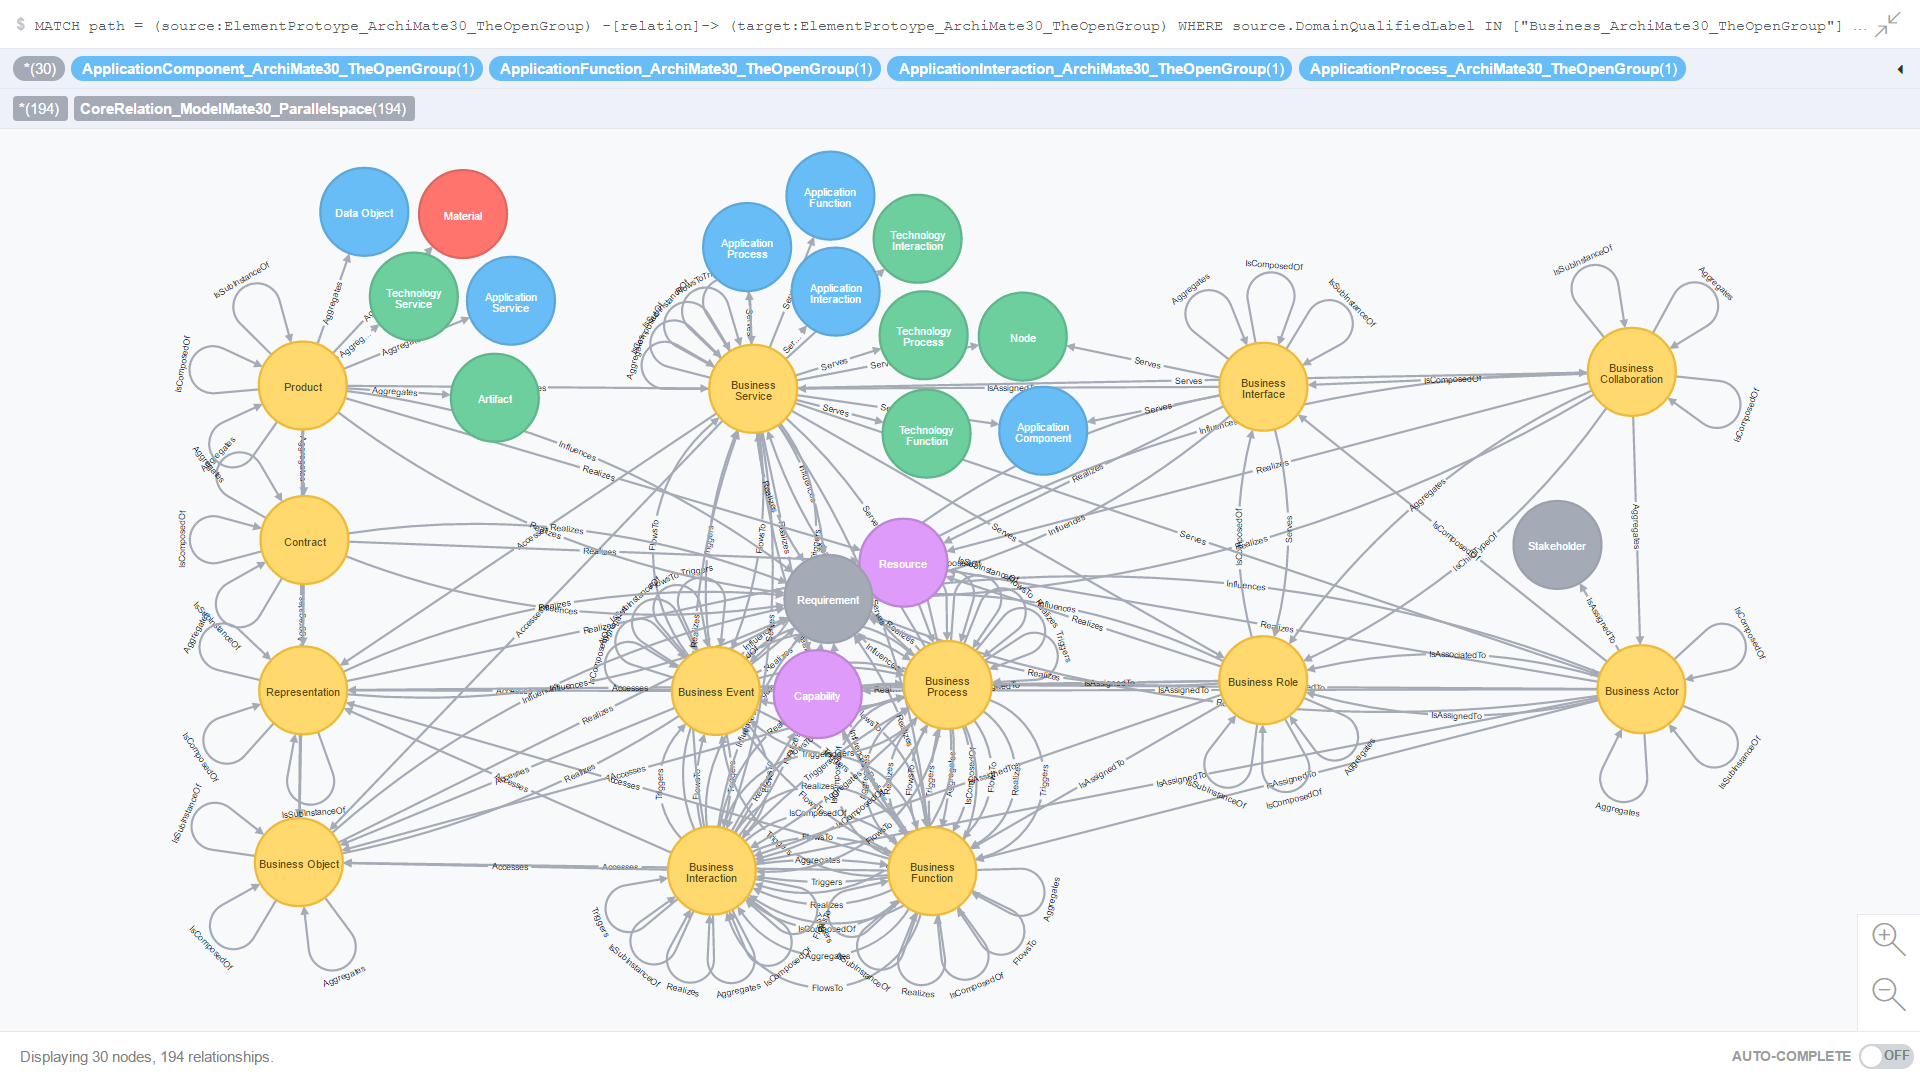
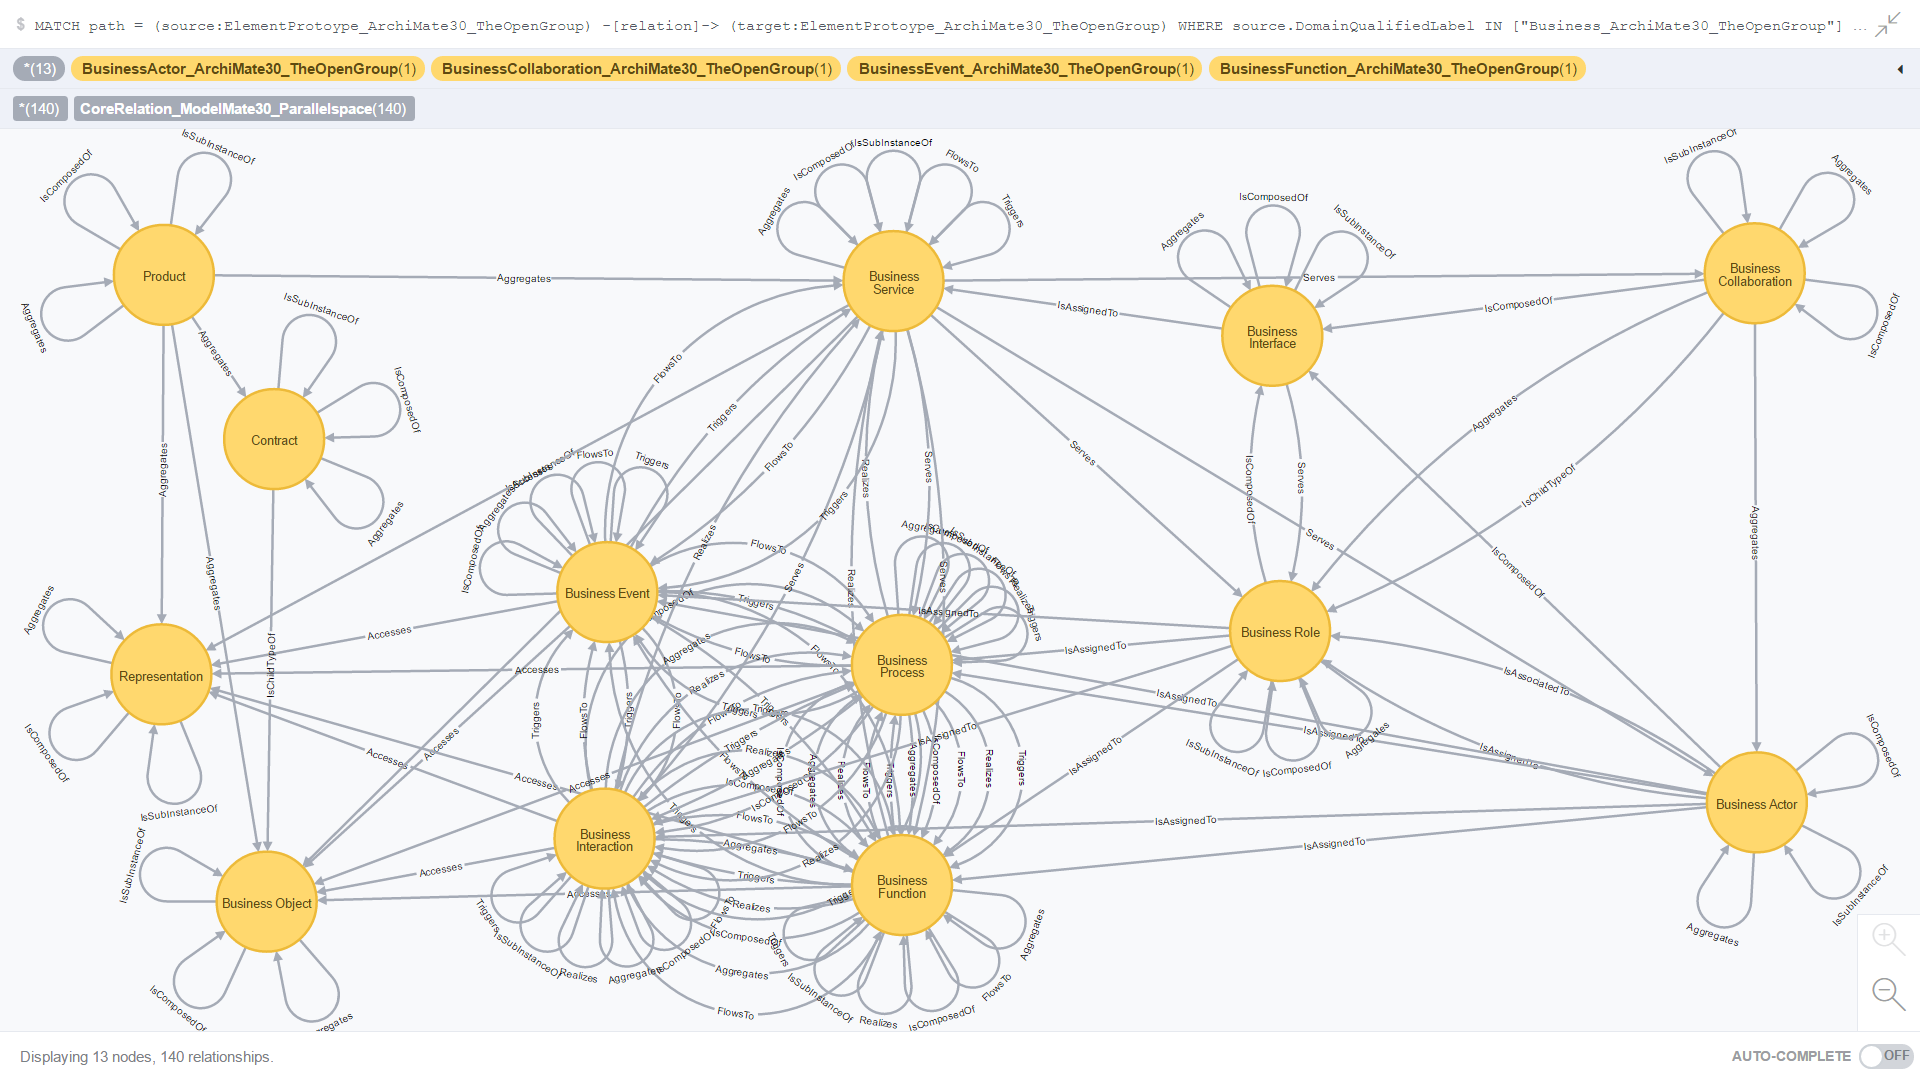
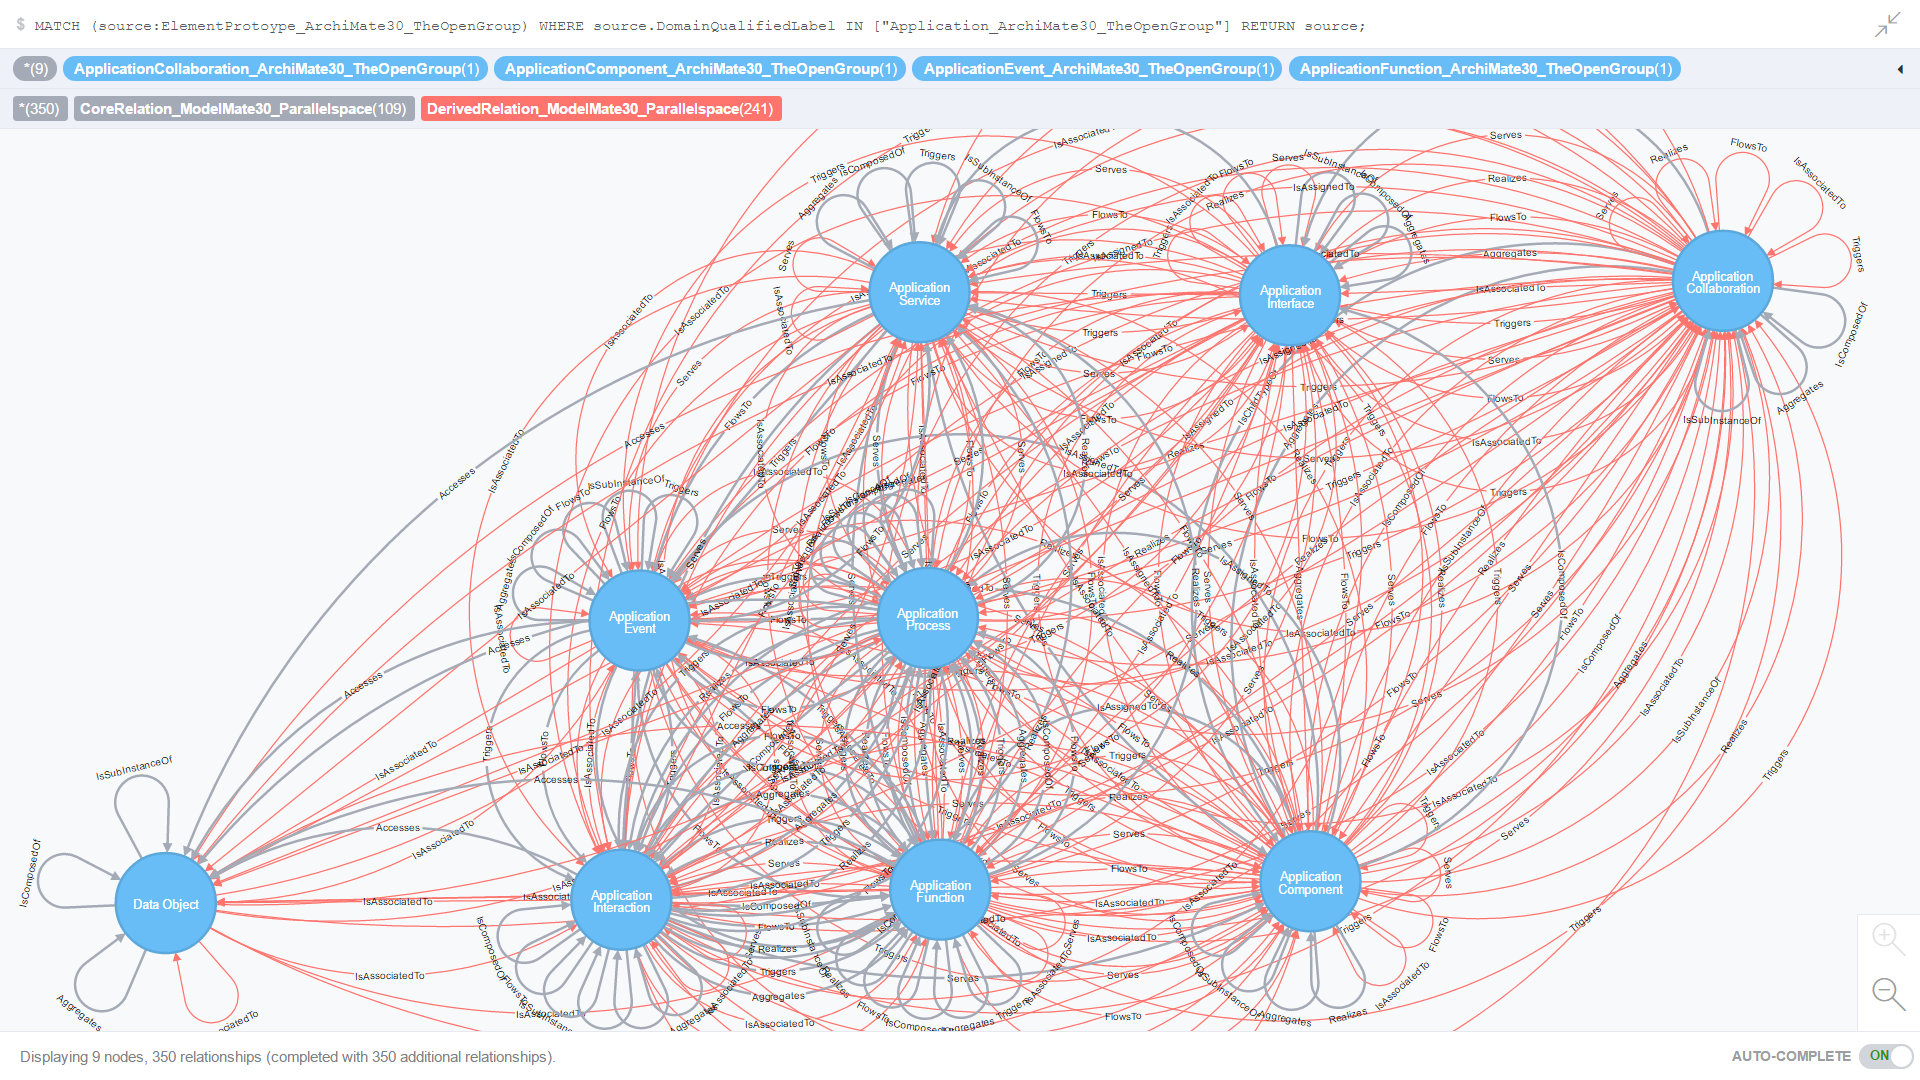
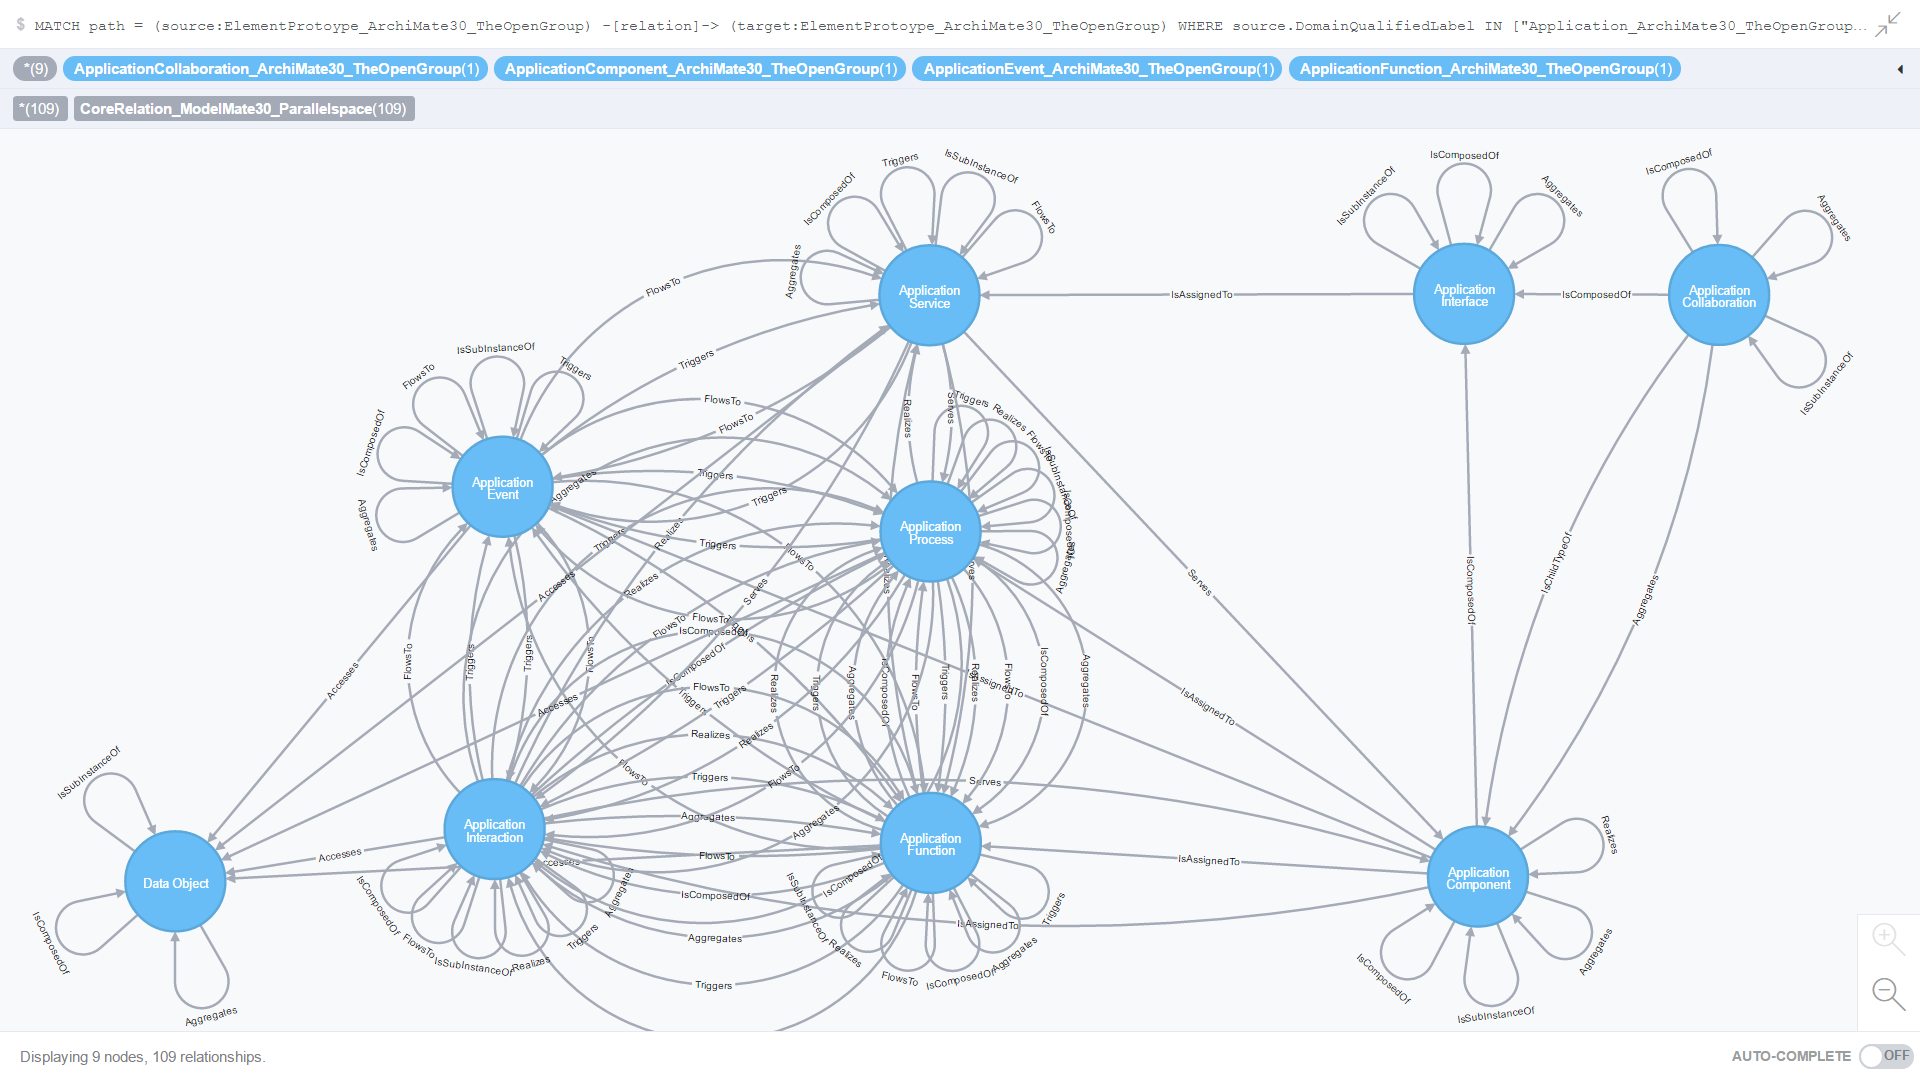
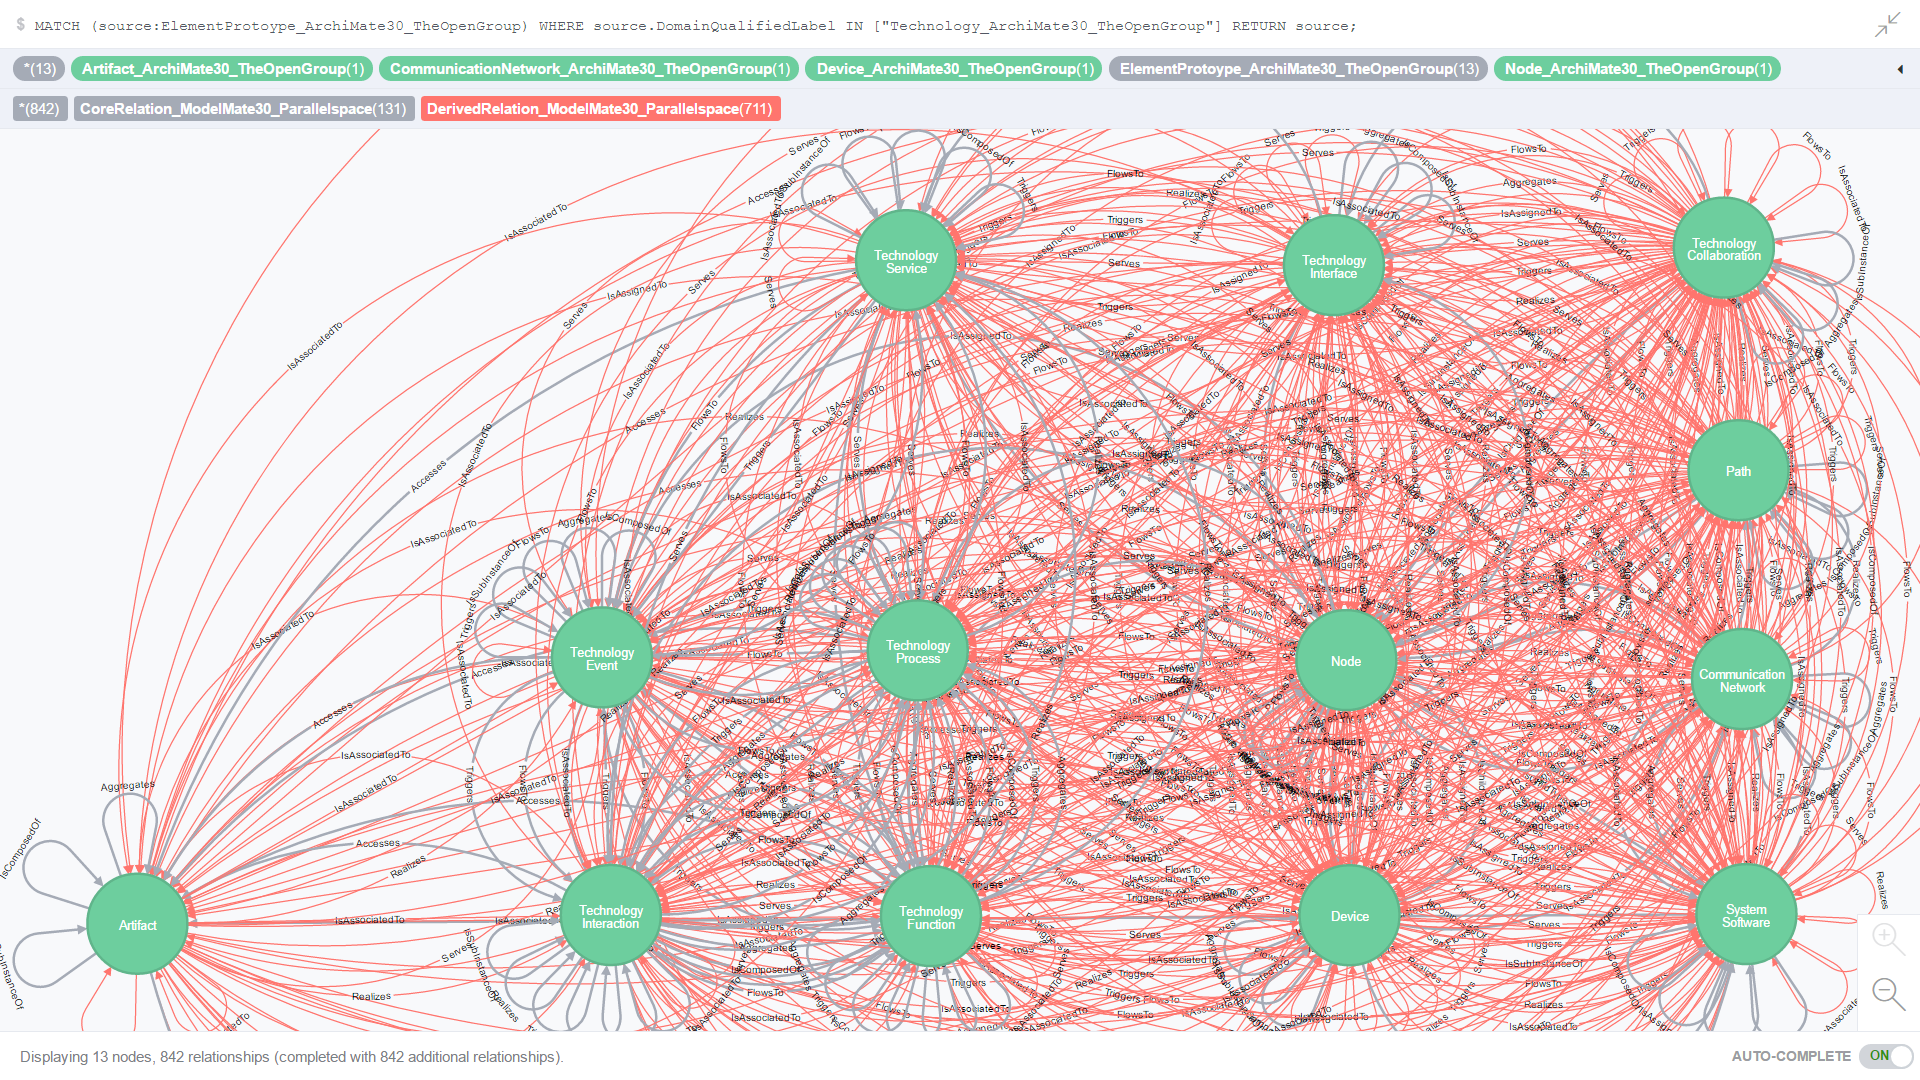
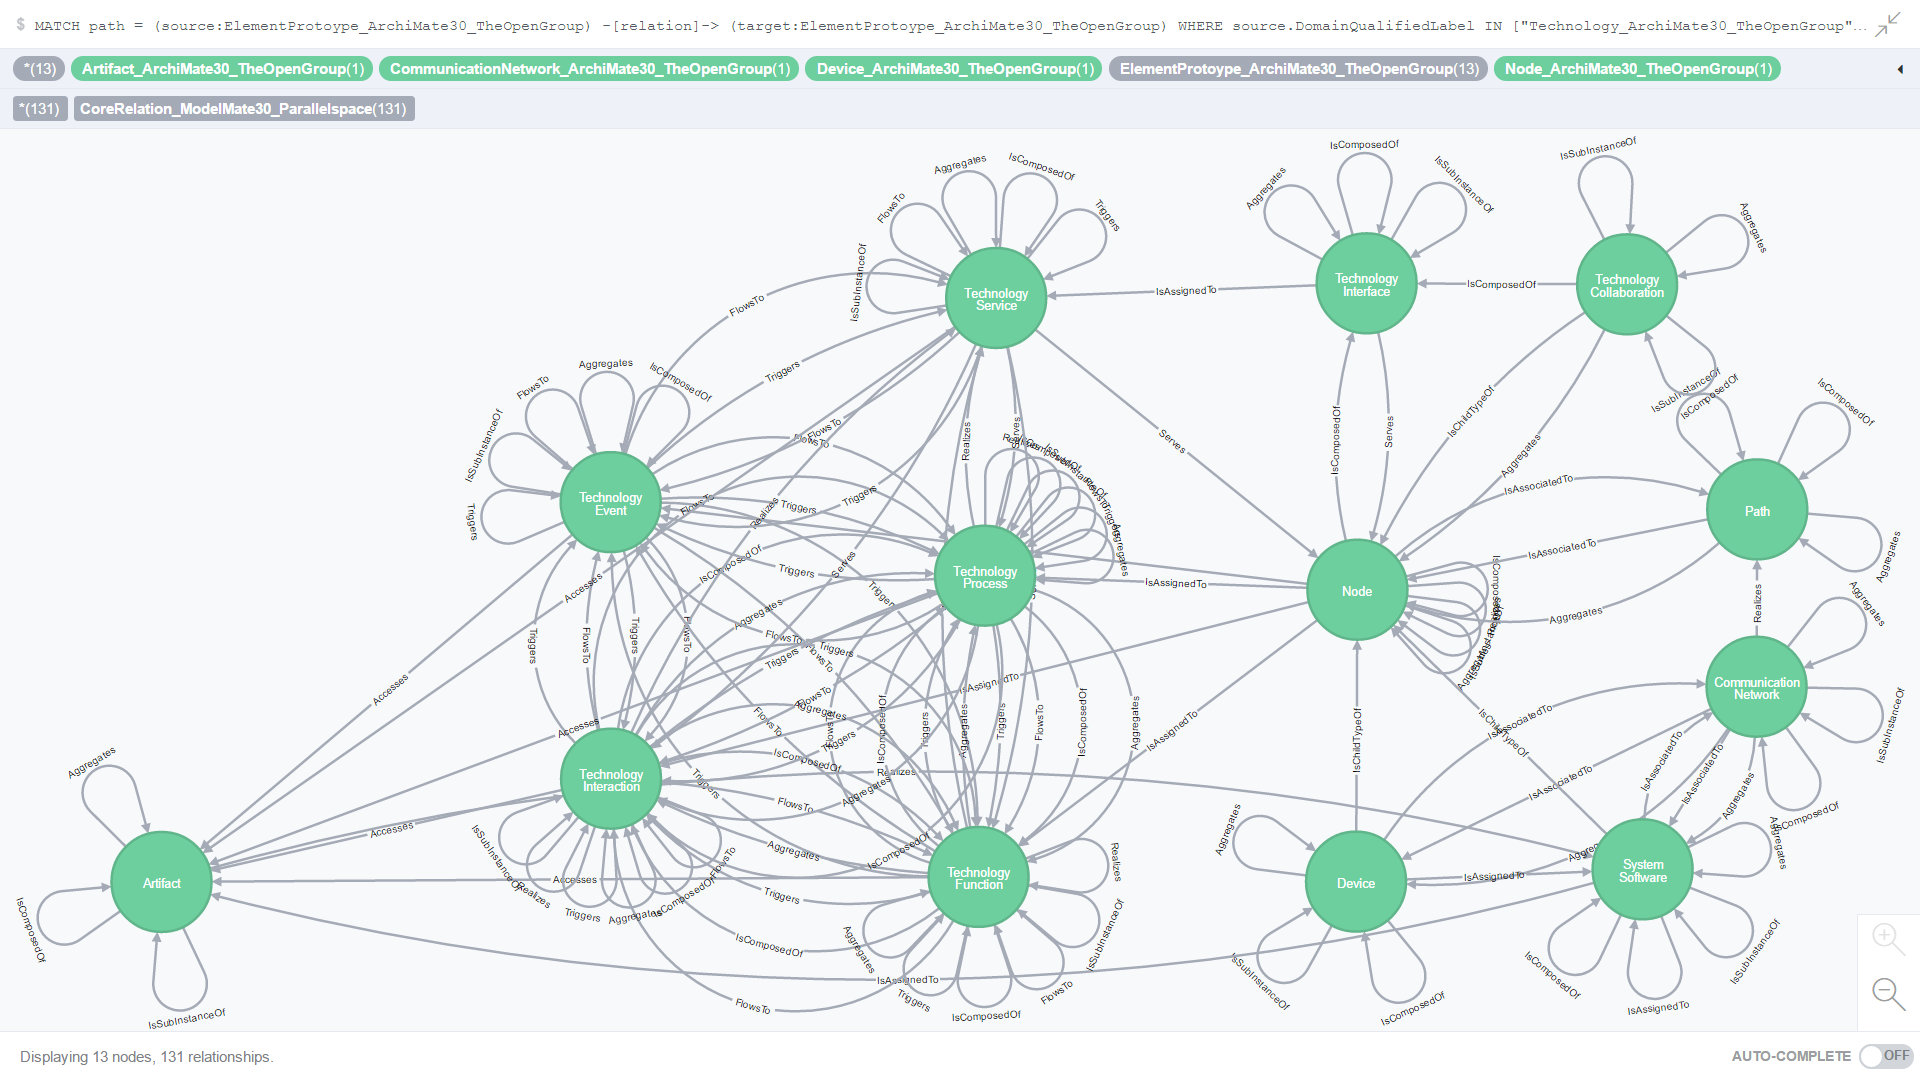
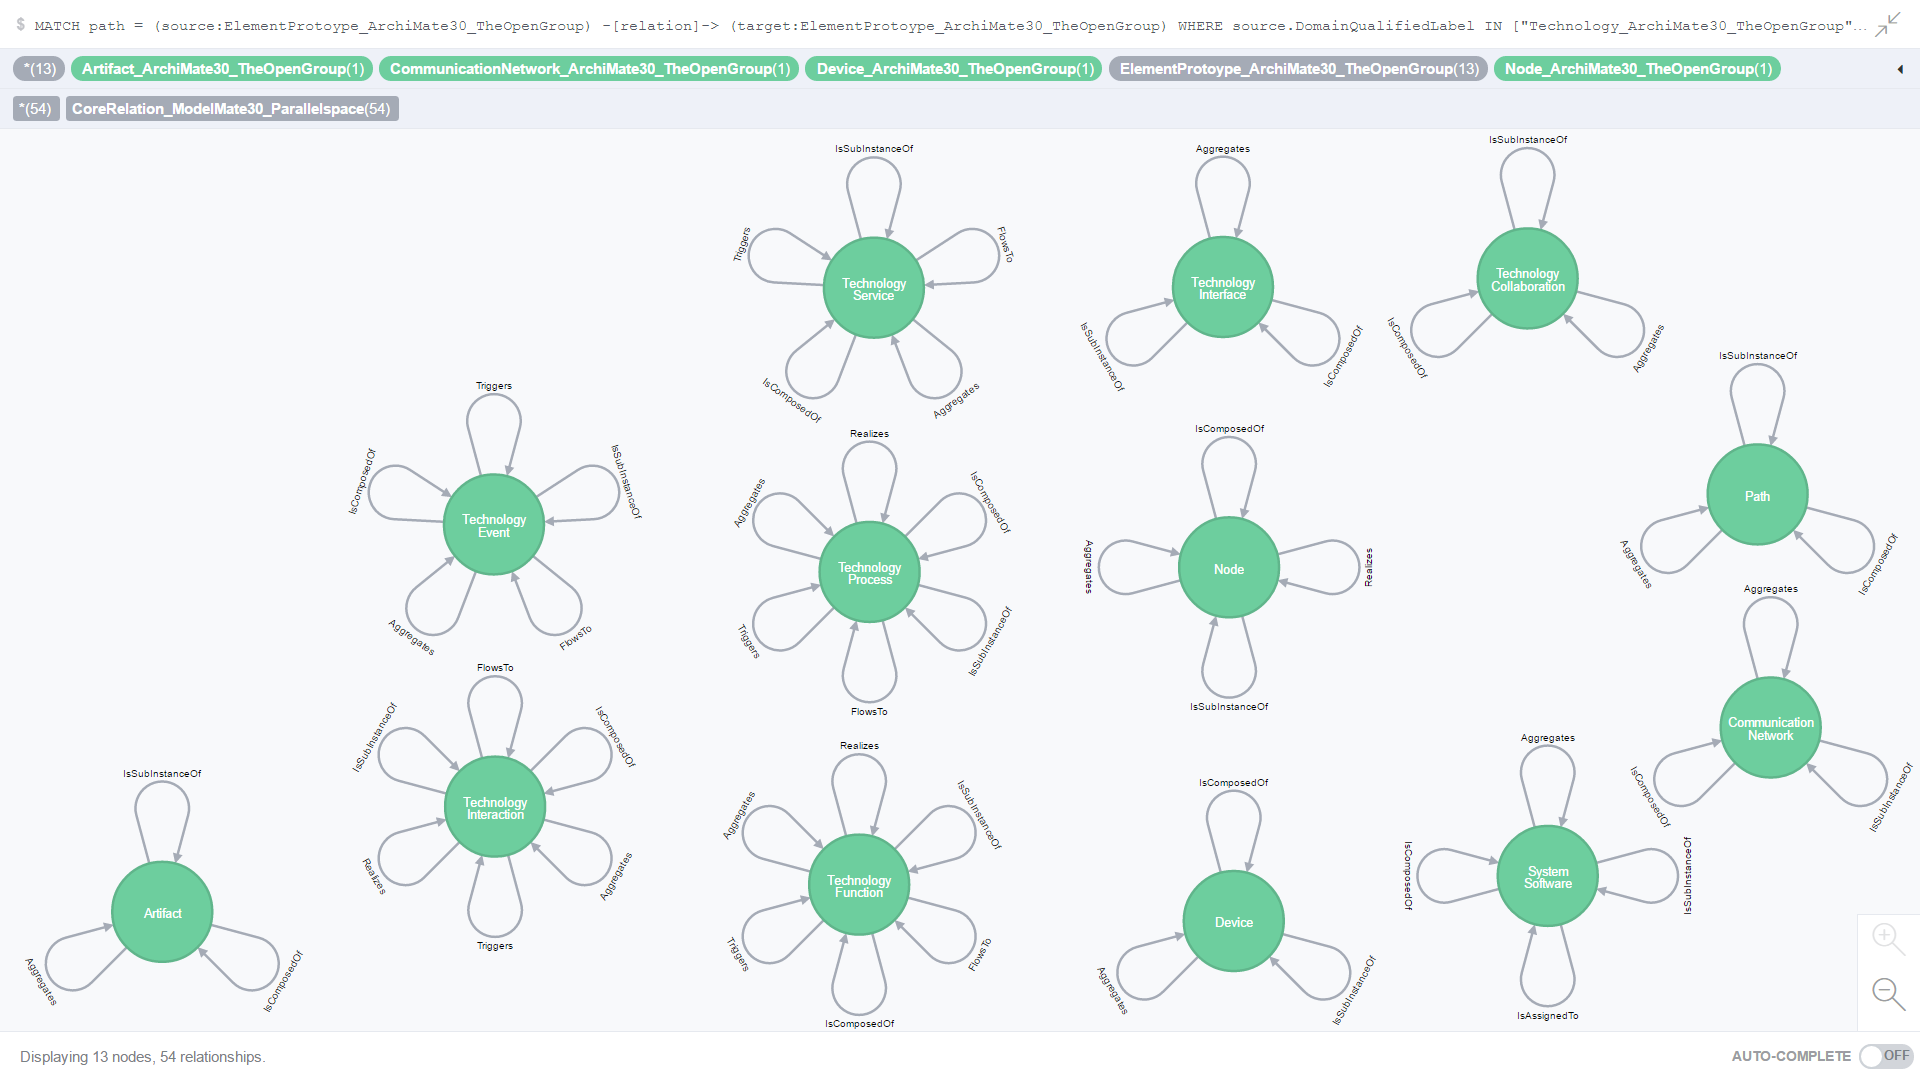
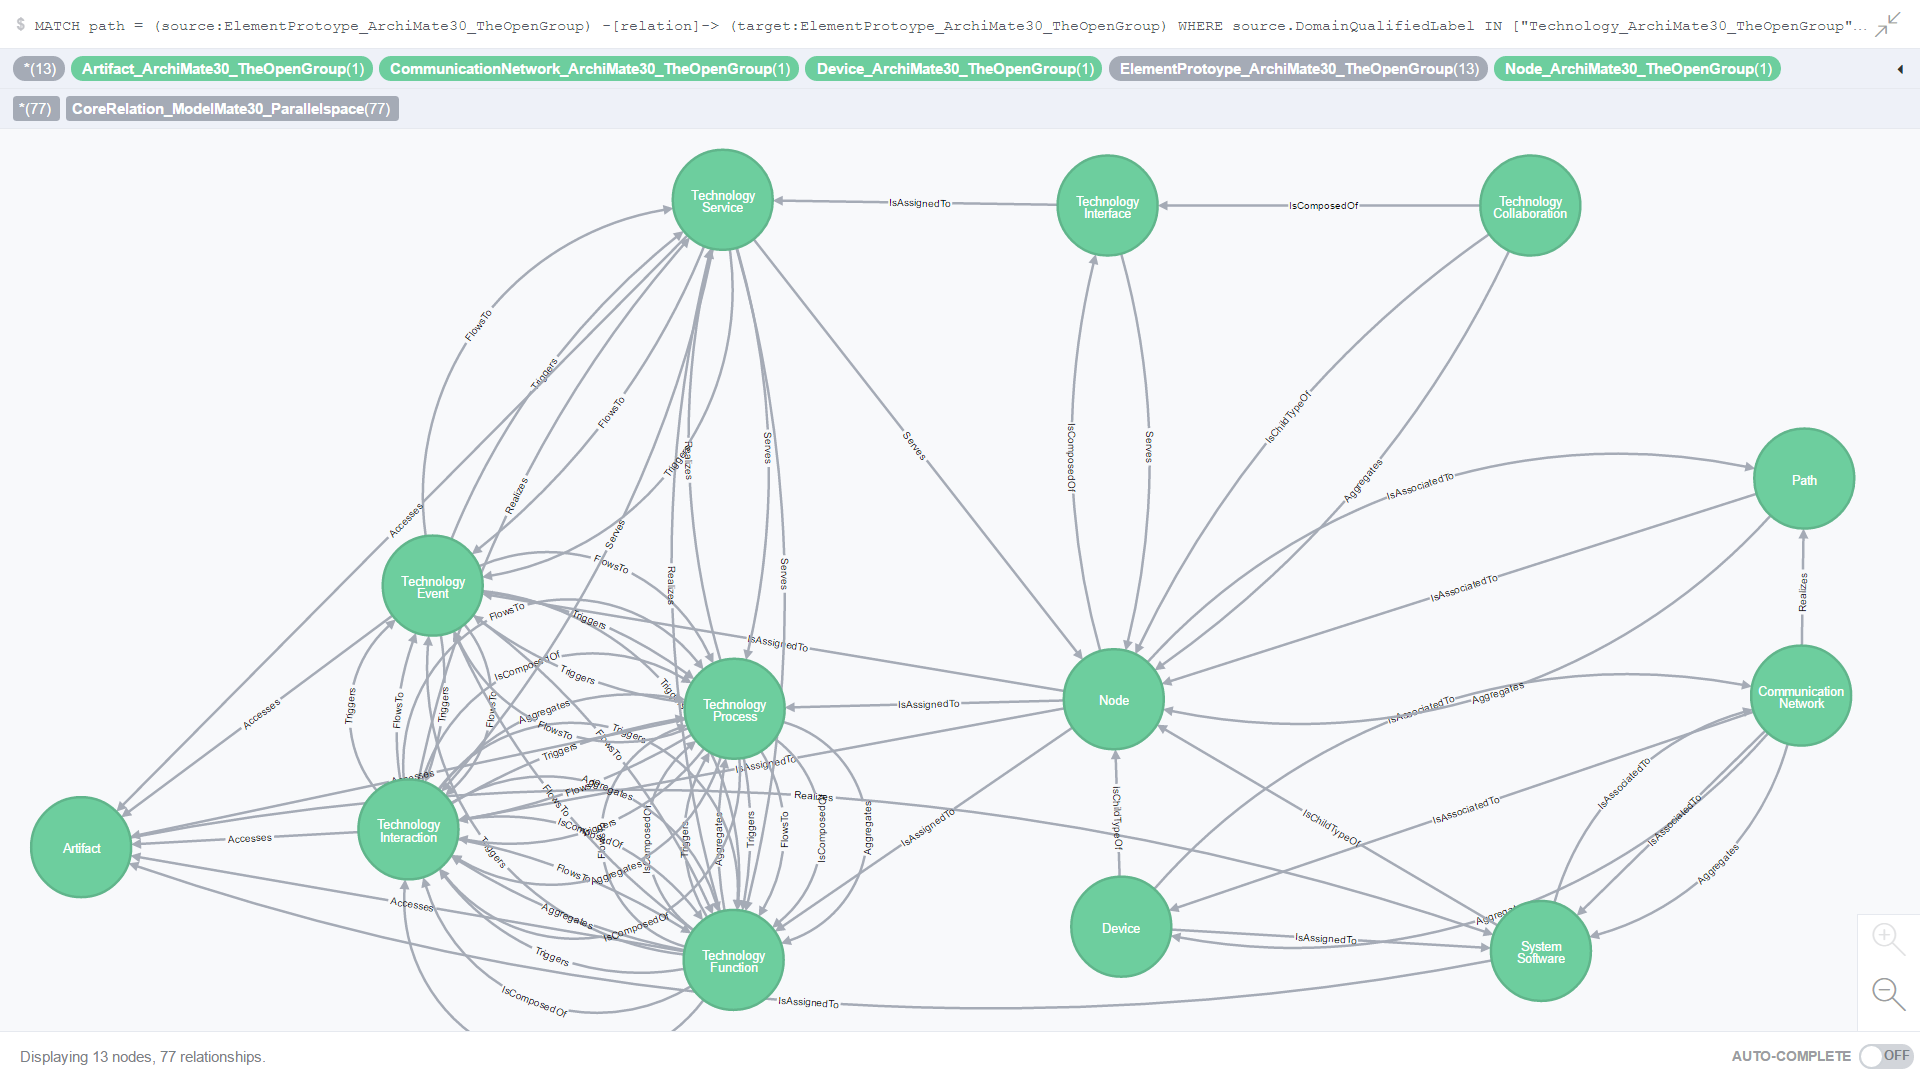
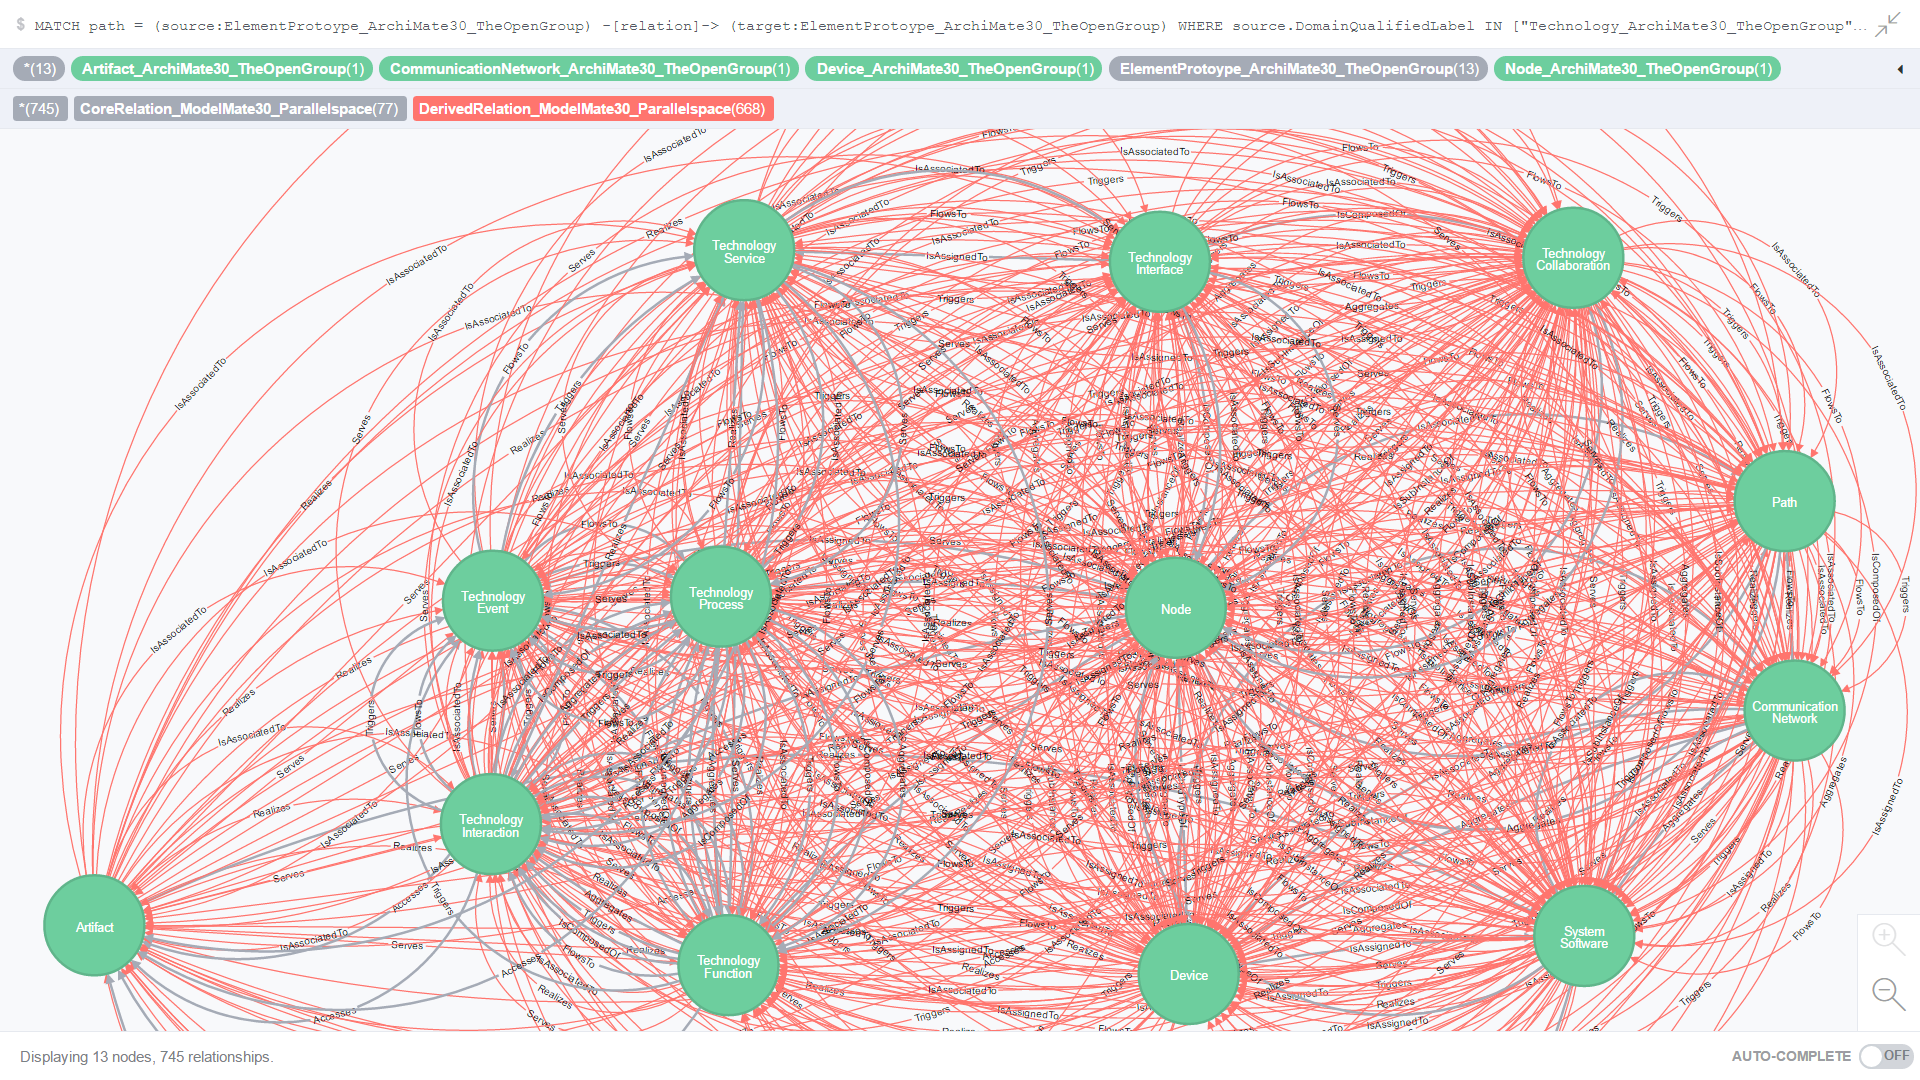
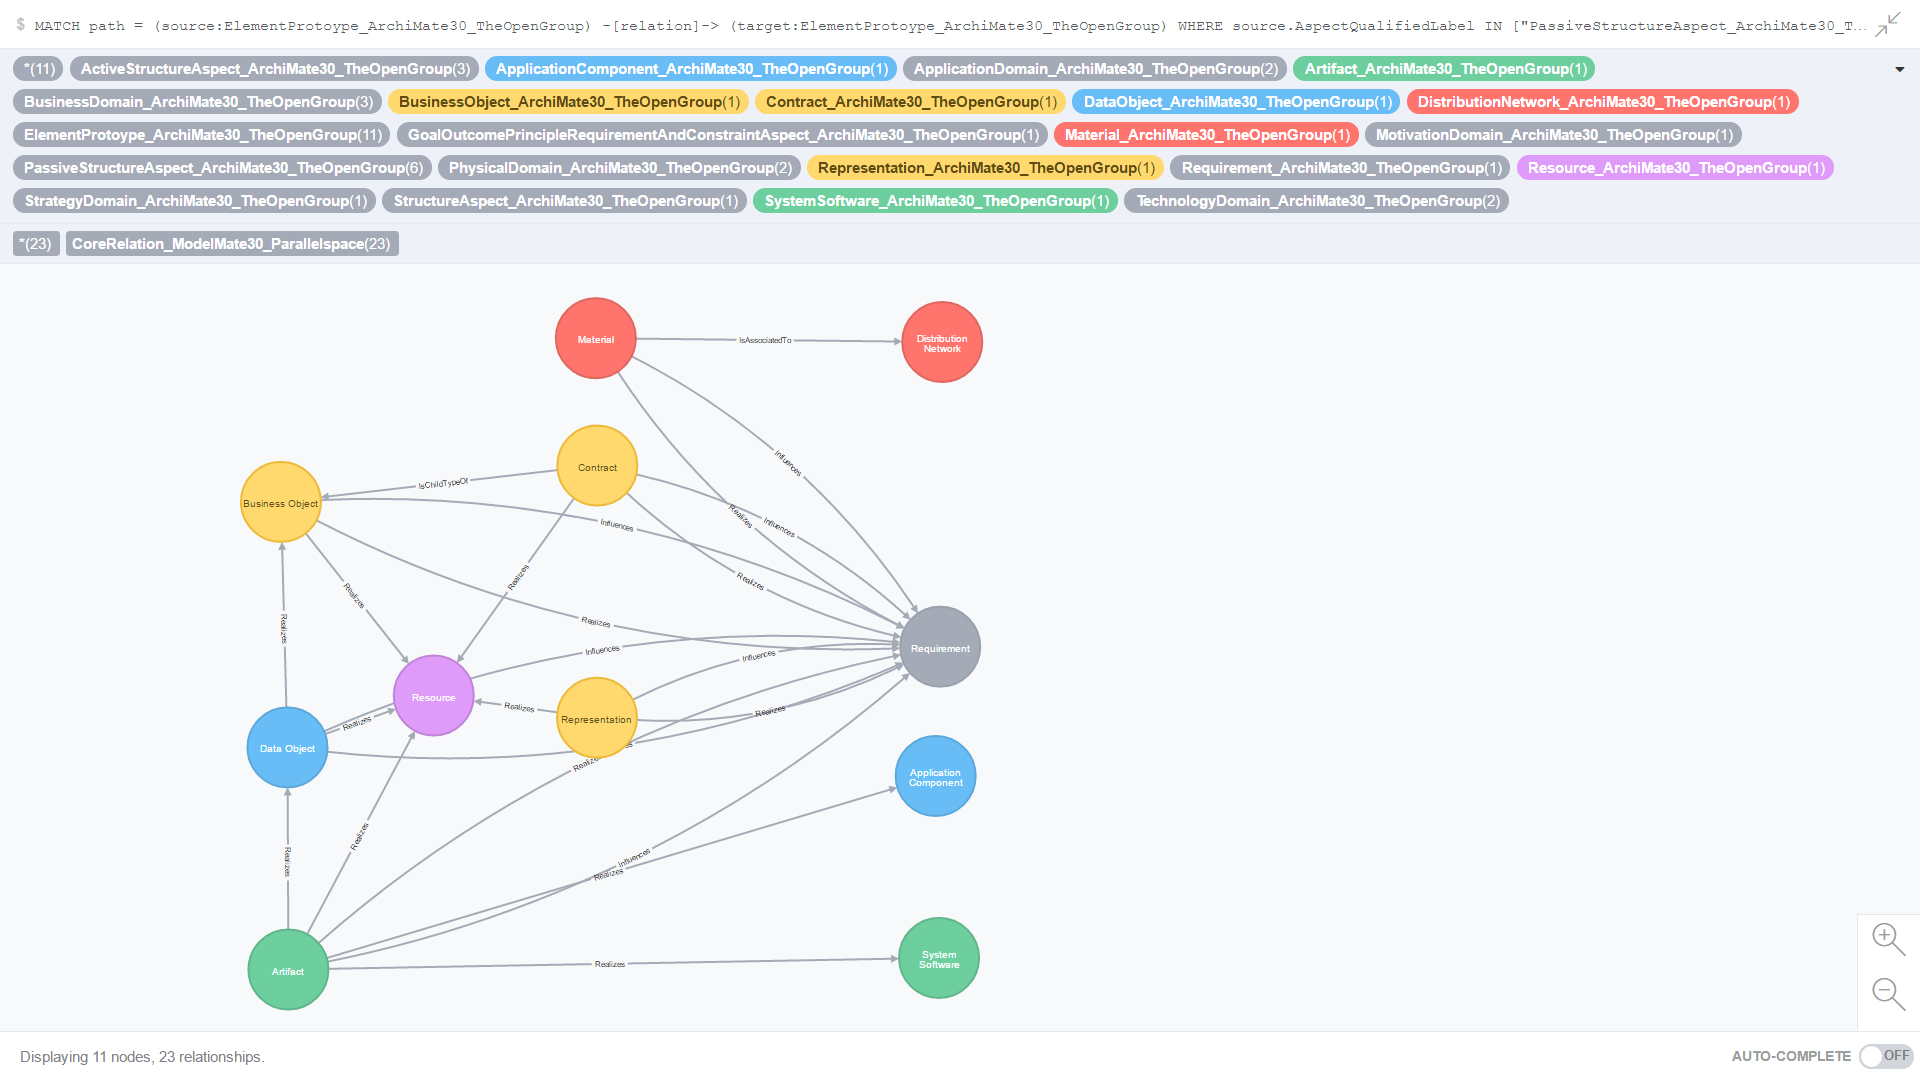
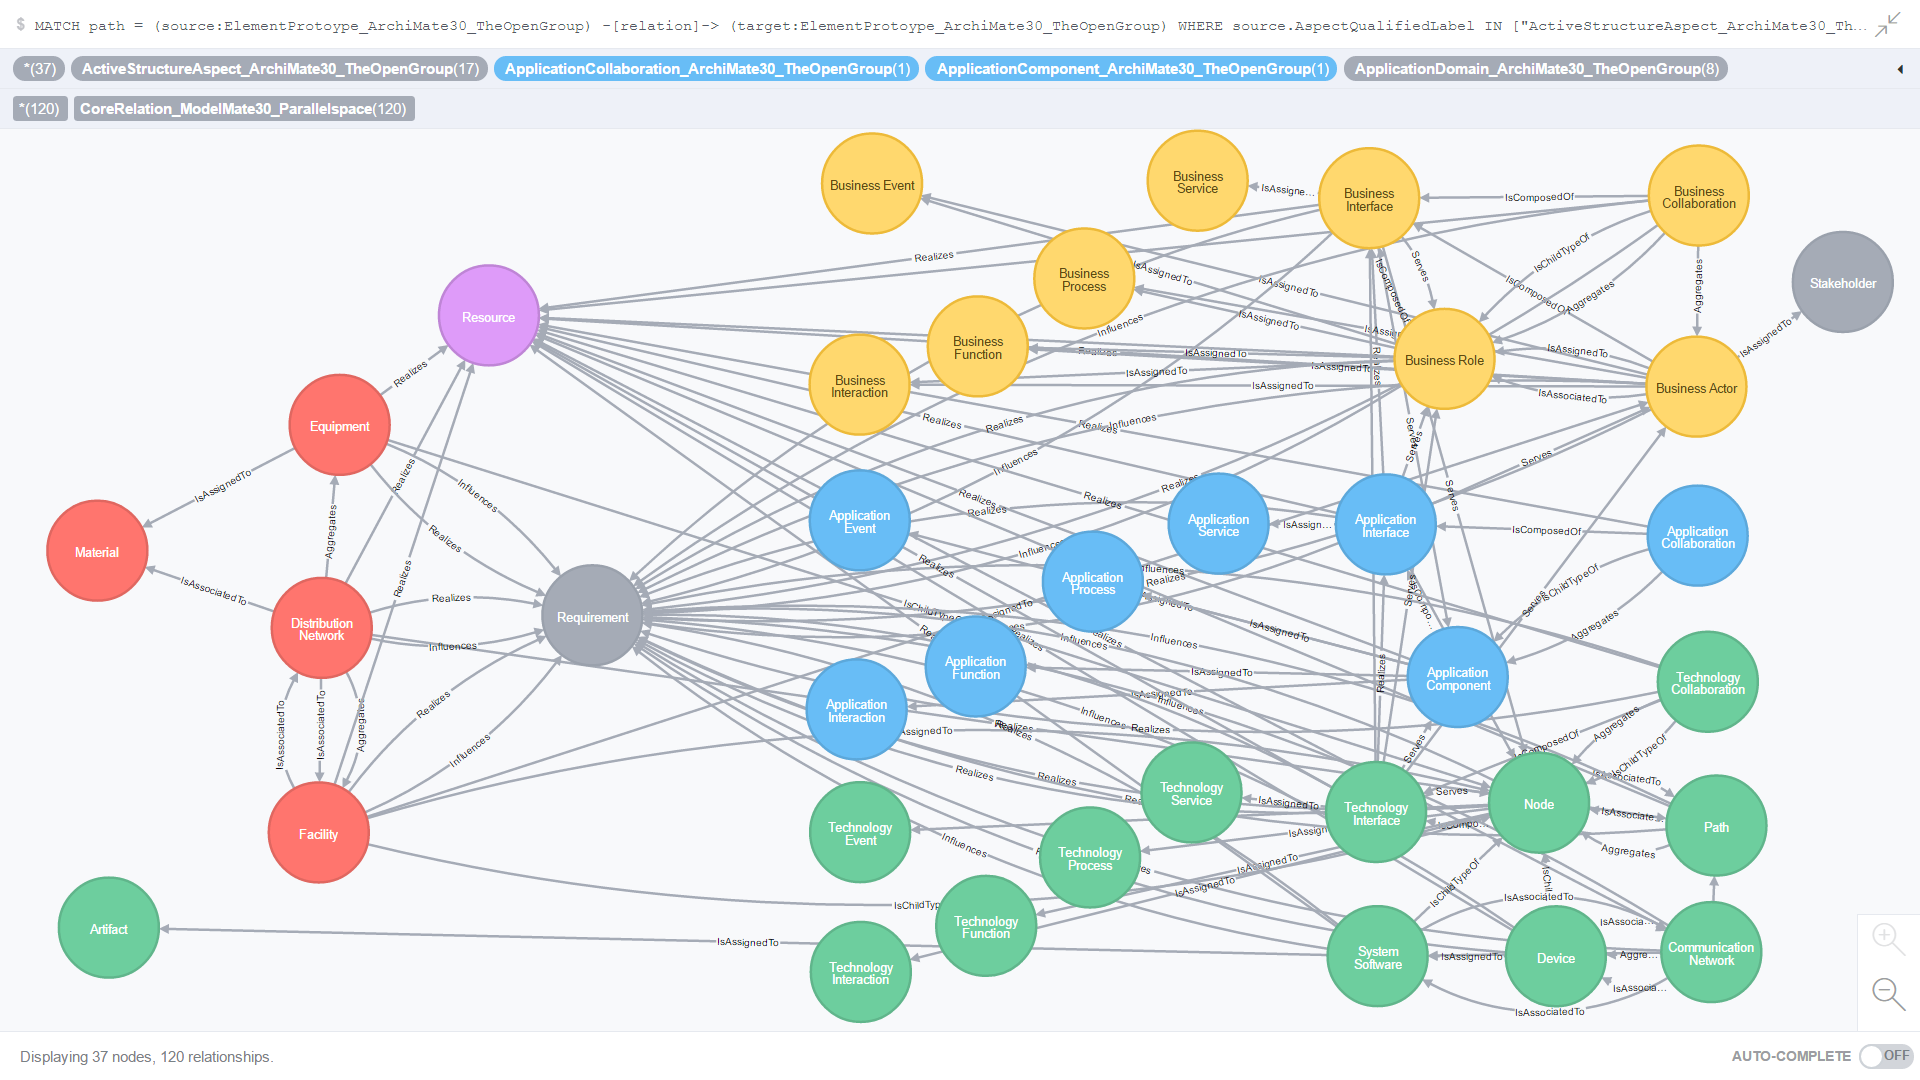
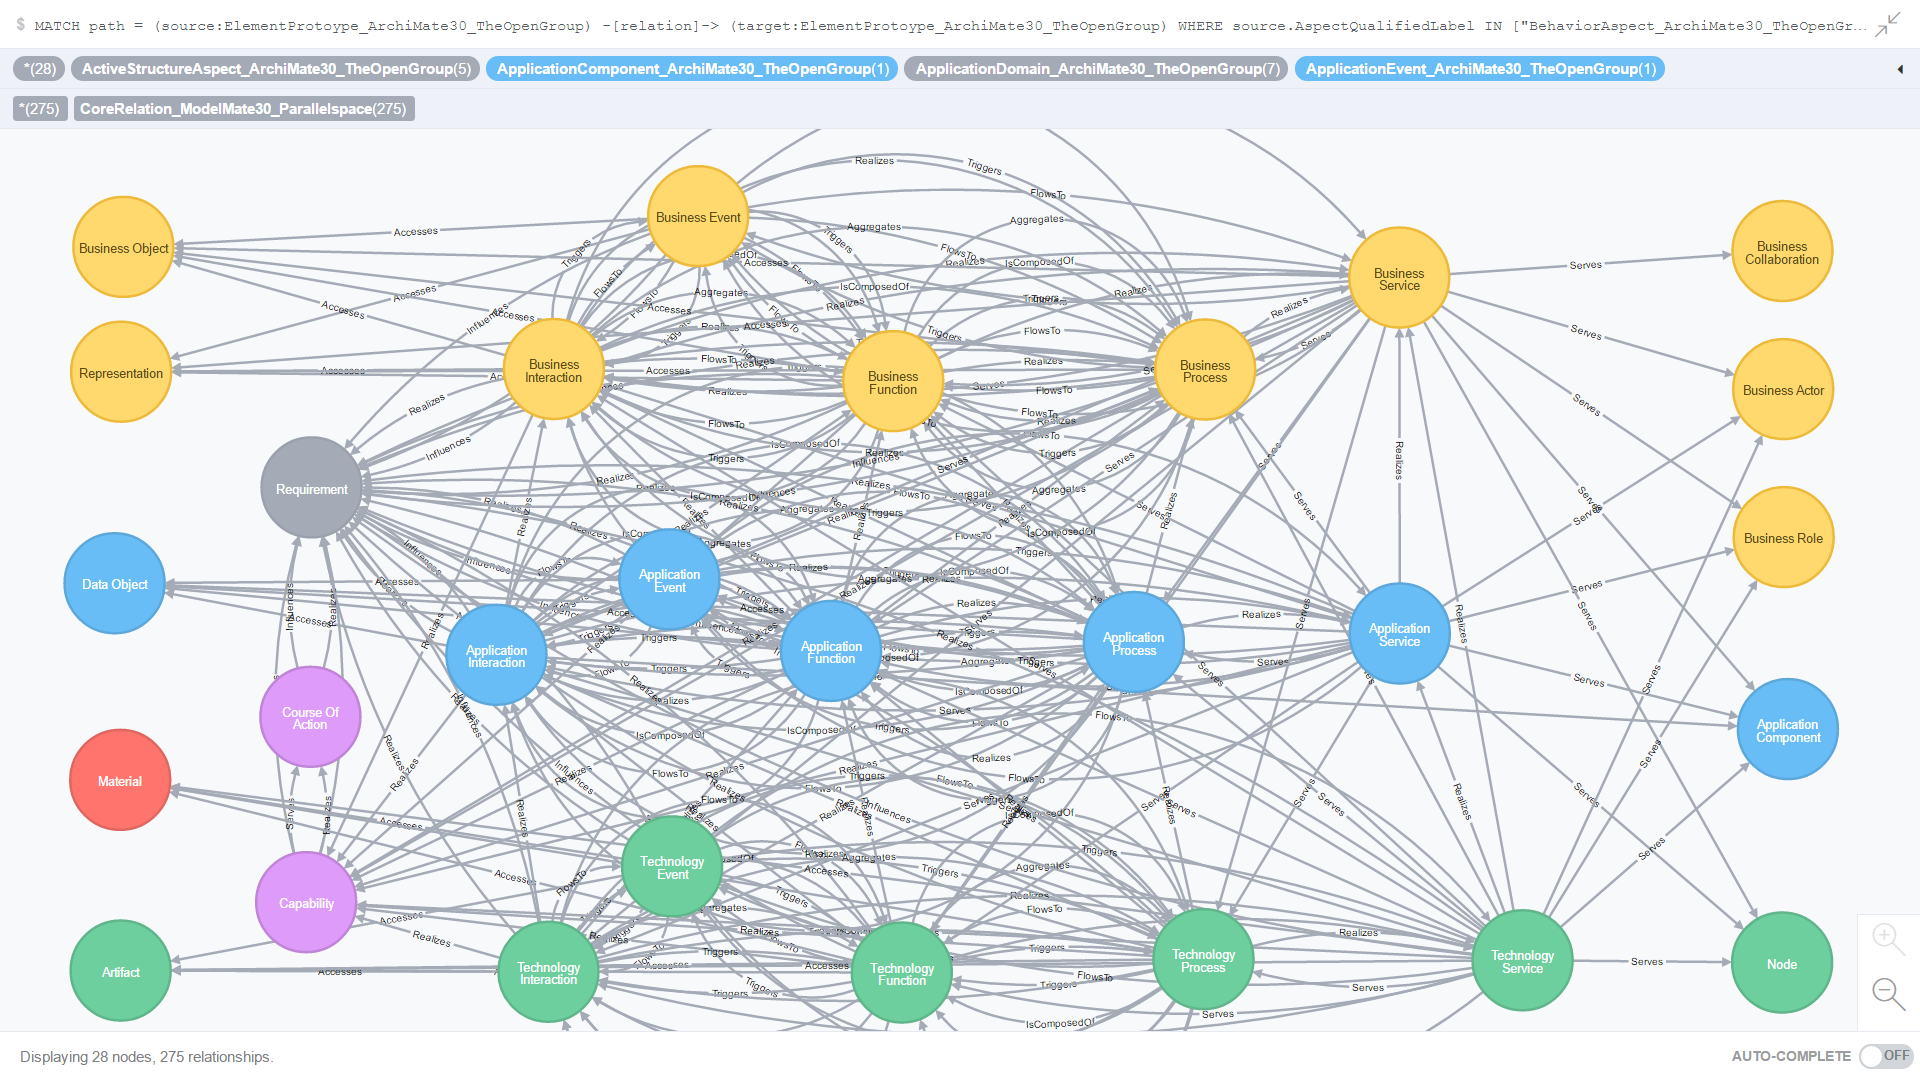
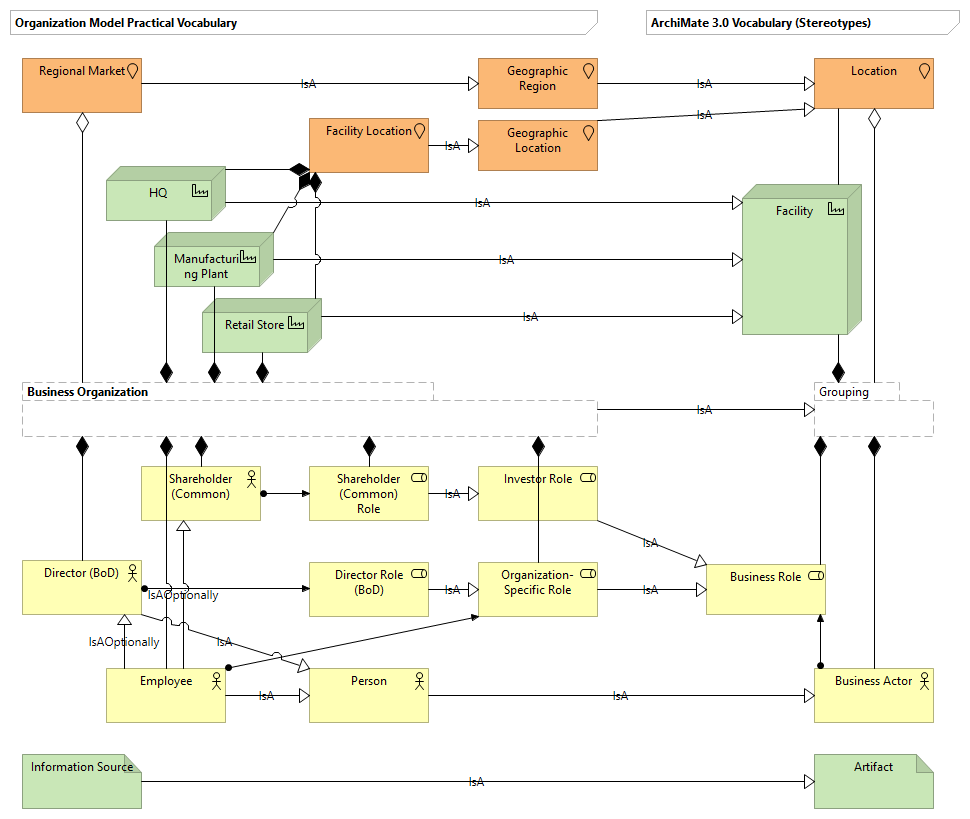
9. International standards for visual modeling languages
A significant investment has been made in applying #Graphitization to language modeling; specifically, languages for enterprise architecture like ArchiMate.
ArchiMate References
- Using ArchiMate 2.1 to Model Product or Service Markets
- ArchiMate 3.0: What is the preferred way to model a Server Farm?
- How do I model “X” using ArchiMate?
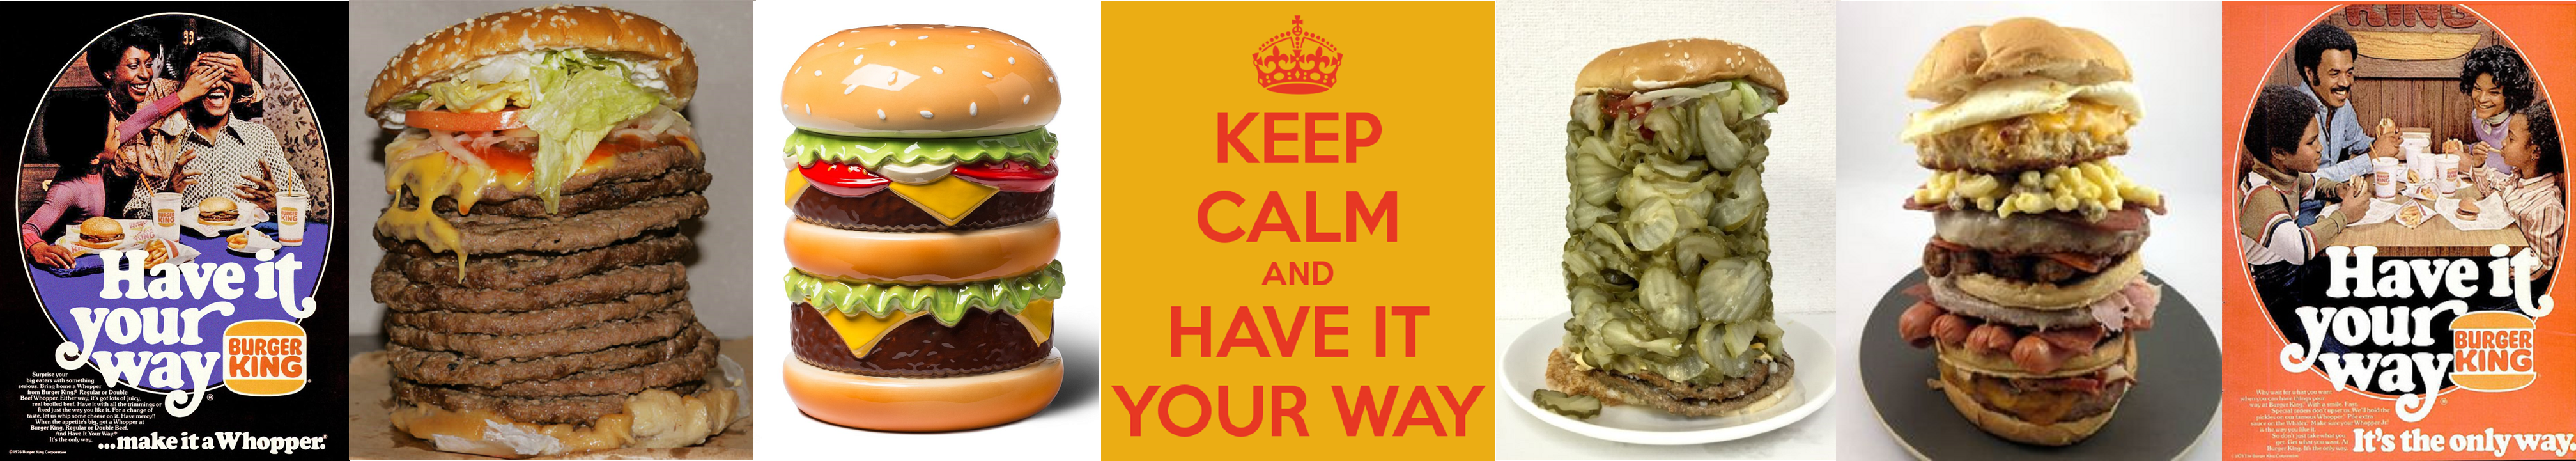
- Crossing the EA Chasm: ArchiMate “Keep Calm and Have IT Your Way”
- Crossing the EA Chasm: ArchiMate Art
- Crossing the EA Chasm: Re-visioning the ArchiMate Specification
- Crossing the EA Chasm: Reflections on the Current State of ArchiMate
- Crossing the EA Chasm: Re-visioning ArchiMate 3.0 Relations as Verbs
- Crossing the EA Chasm: Re-visioning ArchiMate 3.0 Elements as Adjectives [WIP]
- Crossing the EA Chasm: #Graphitization of ArchiMate 3.0 – Iteration 1
- Crossing the EA Chasm: #Graphitization of ArchiMate 3.0 – Iteration 2 (long but meaty)
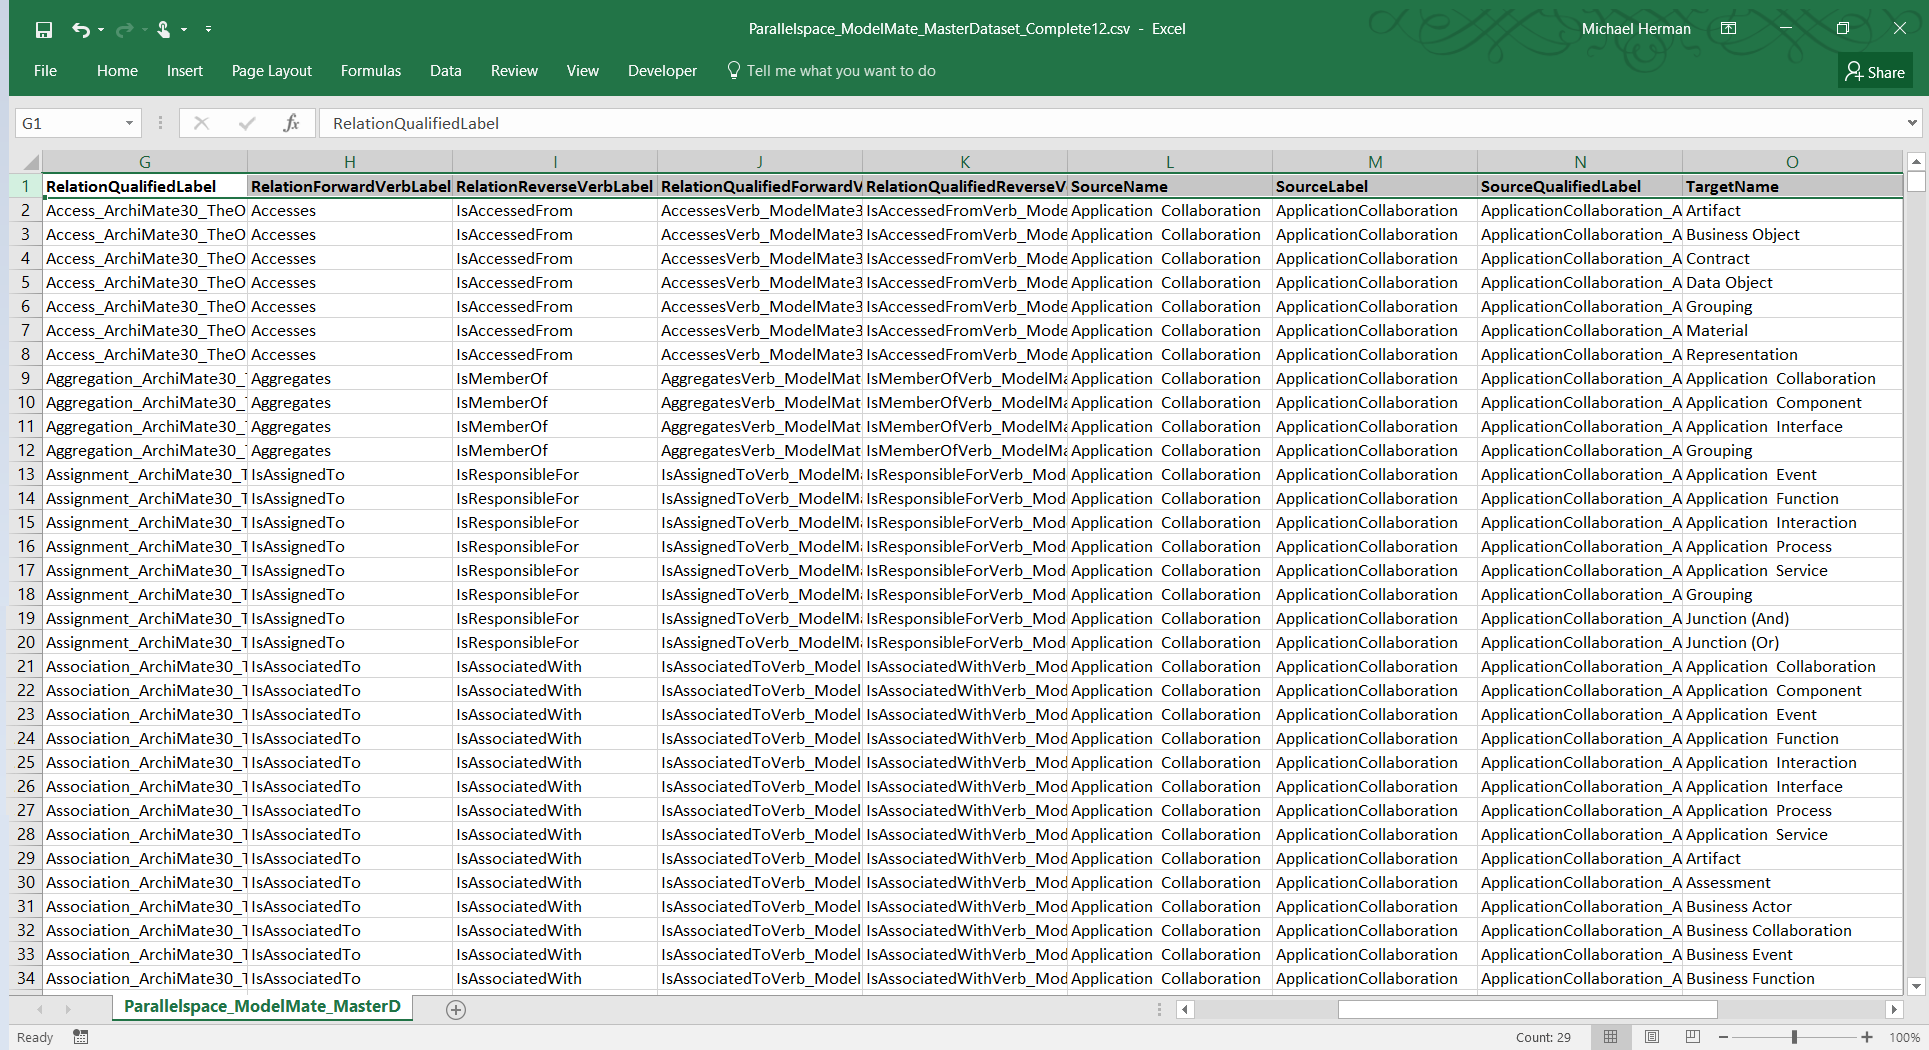
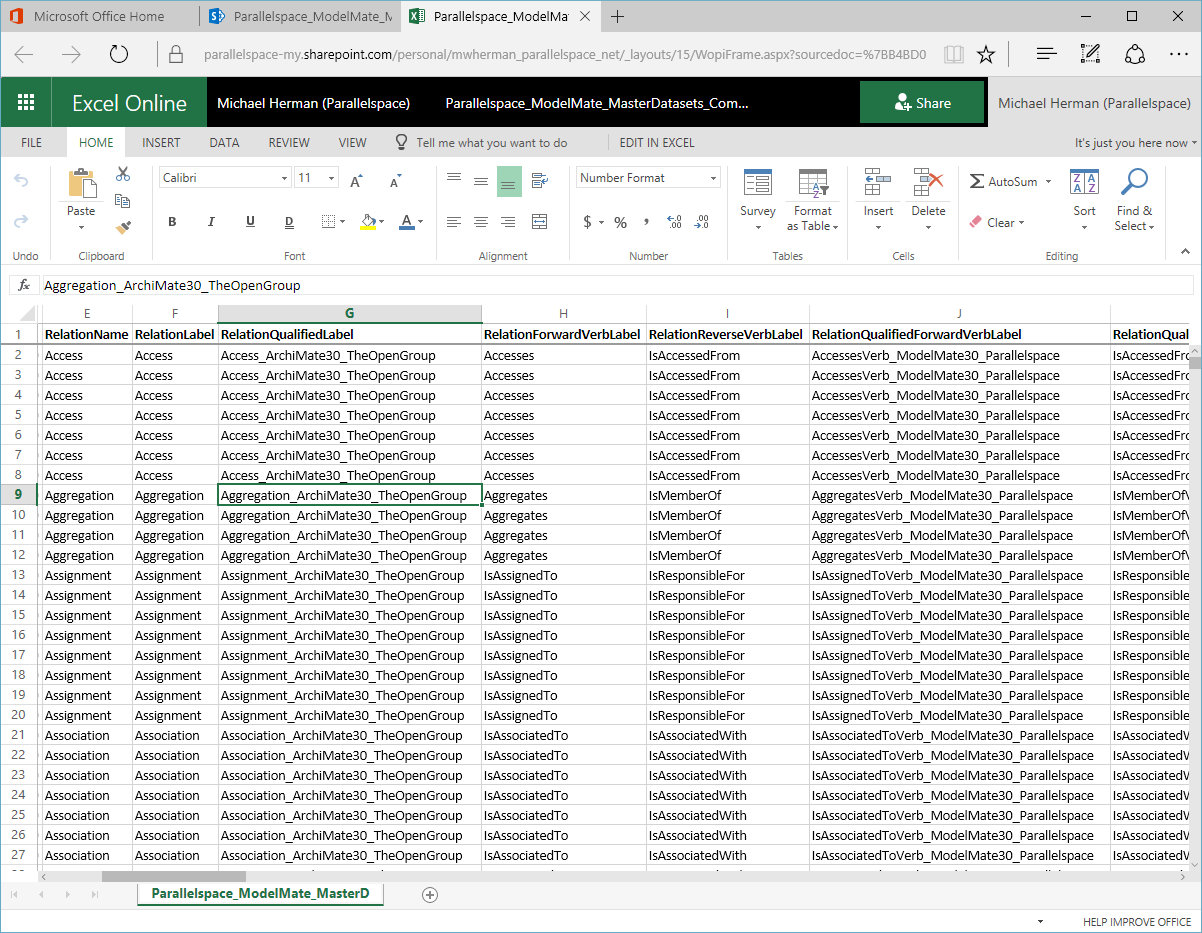
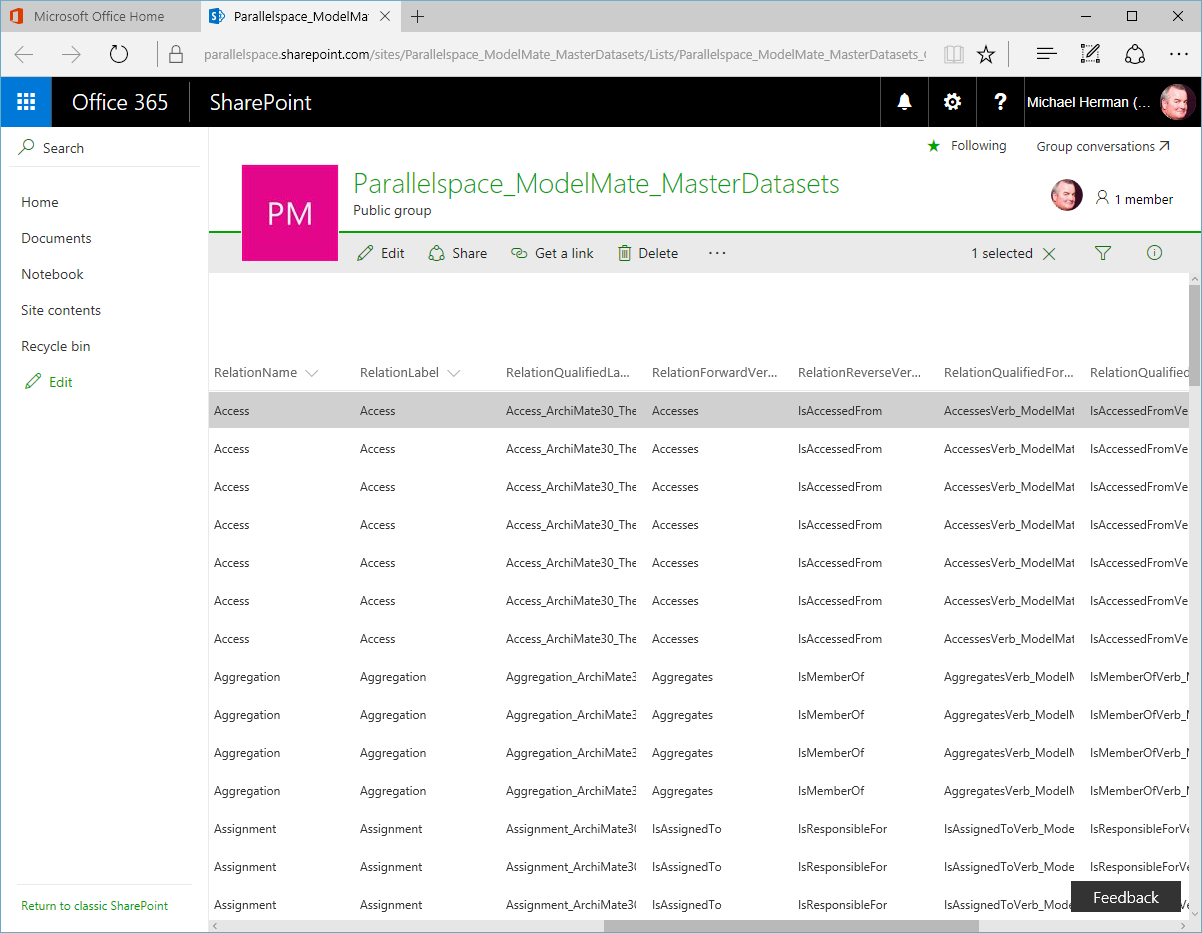
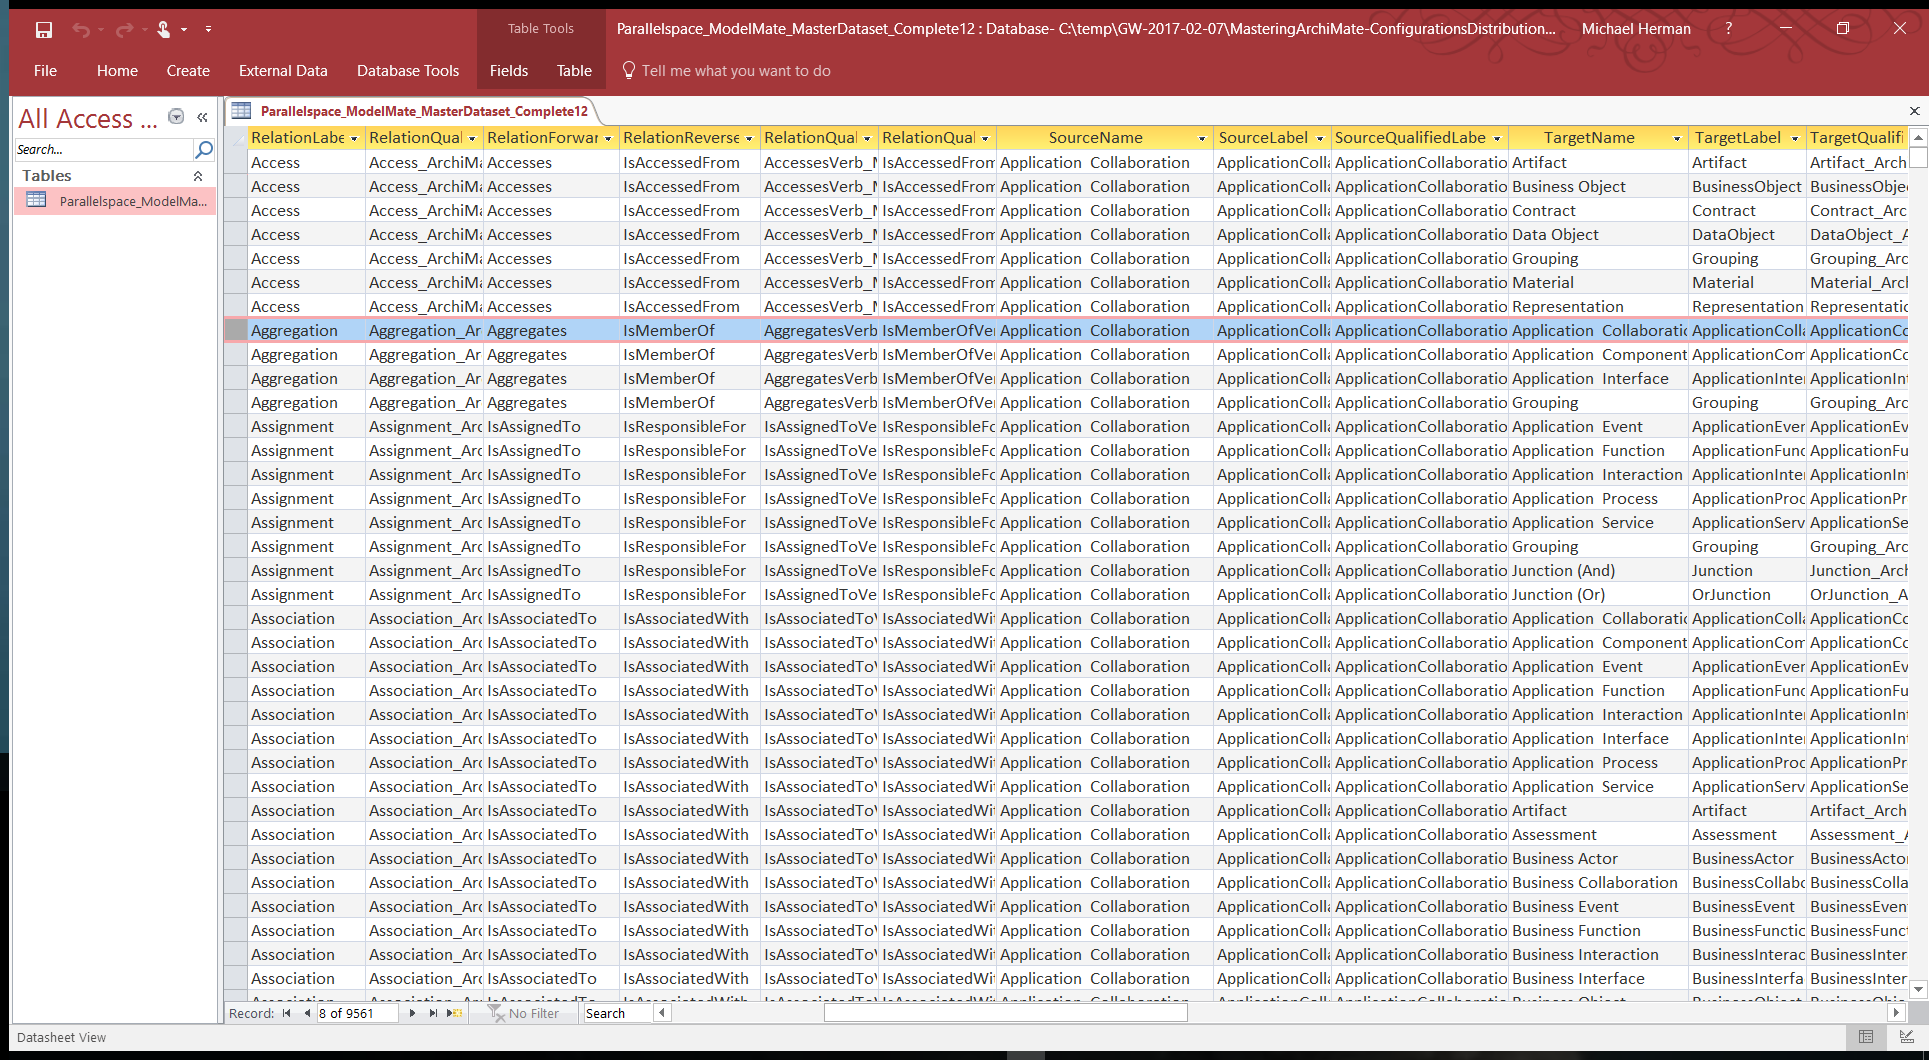
- #Graphitization of ArchiMate: Getting MMOR from ArchiMate using the ModelMate Master Online Repository
10. Enterprise Data Management
Modeling and analyzing enterprise data structures and stores is a common application of #Graphitization; including the modeling of taxonomies and master data.
References
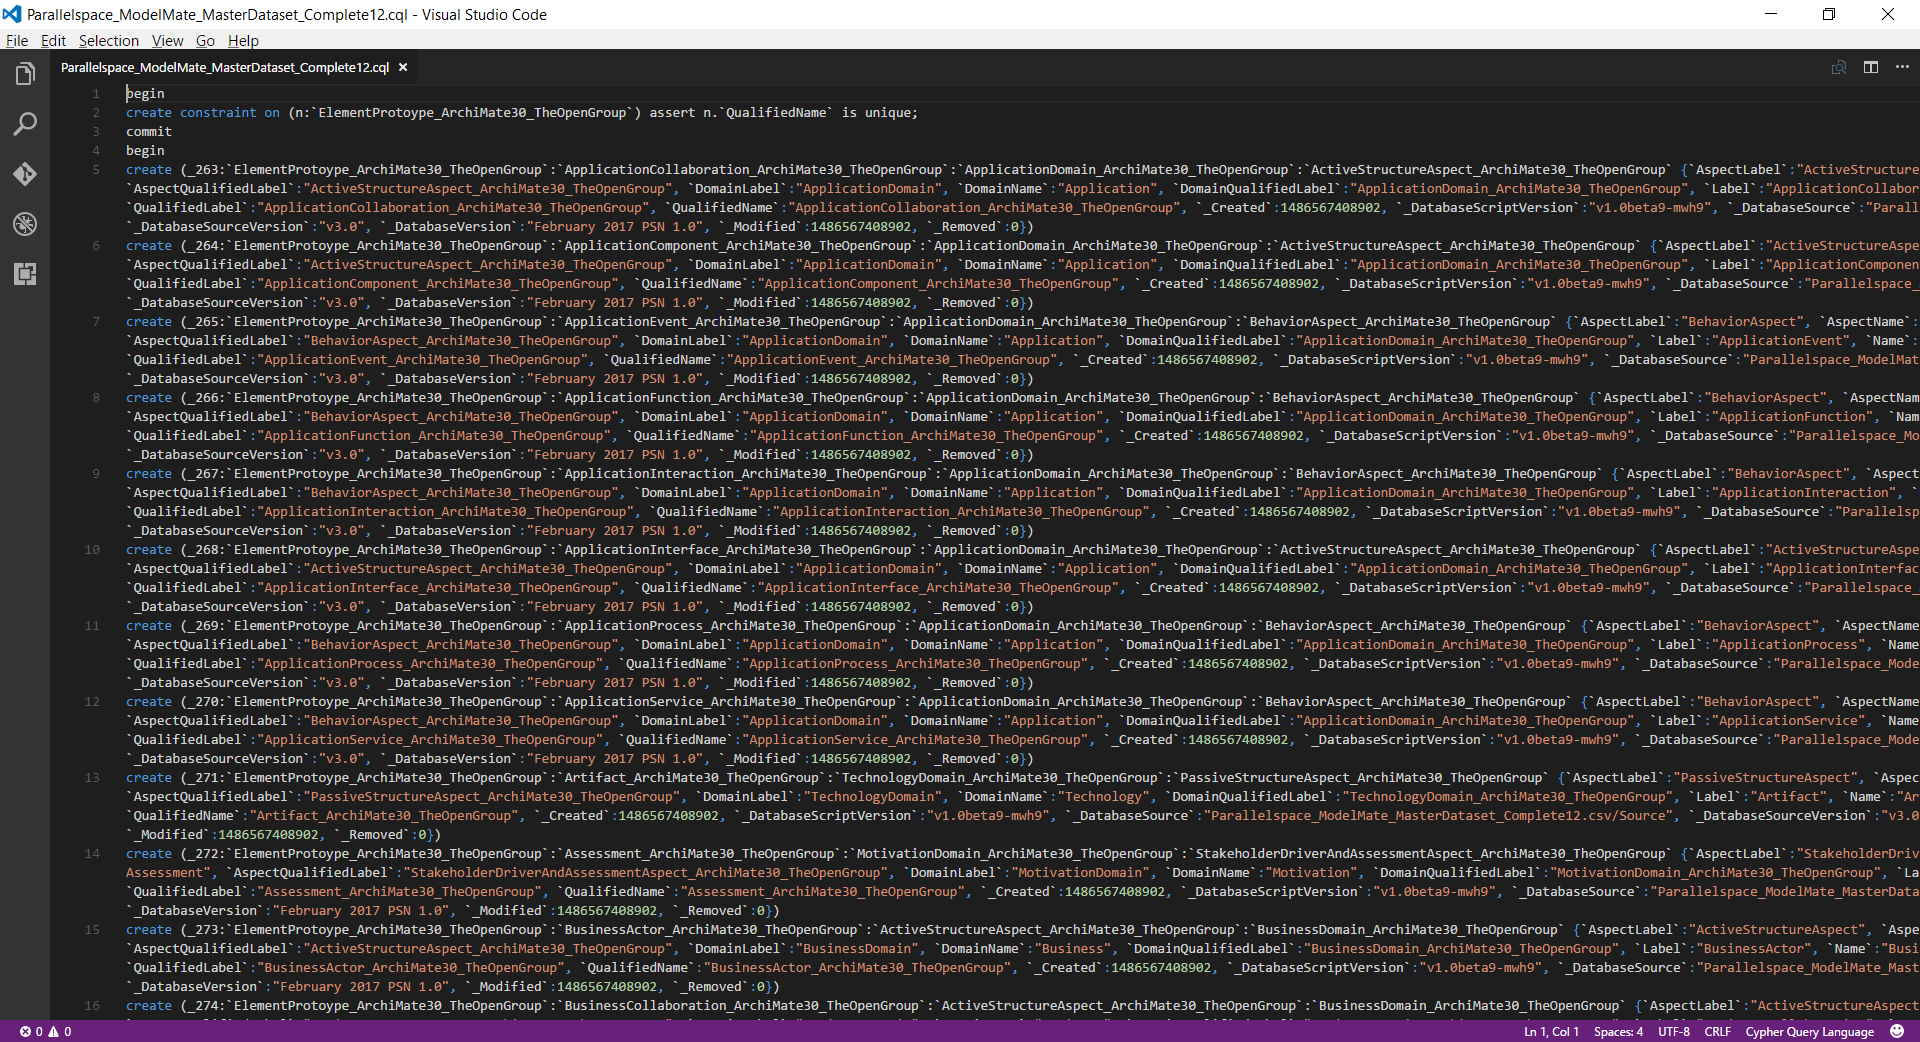
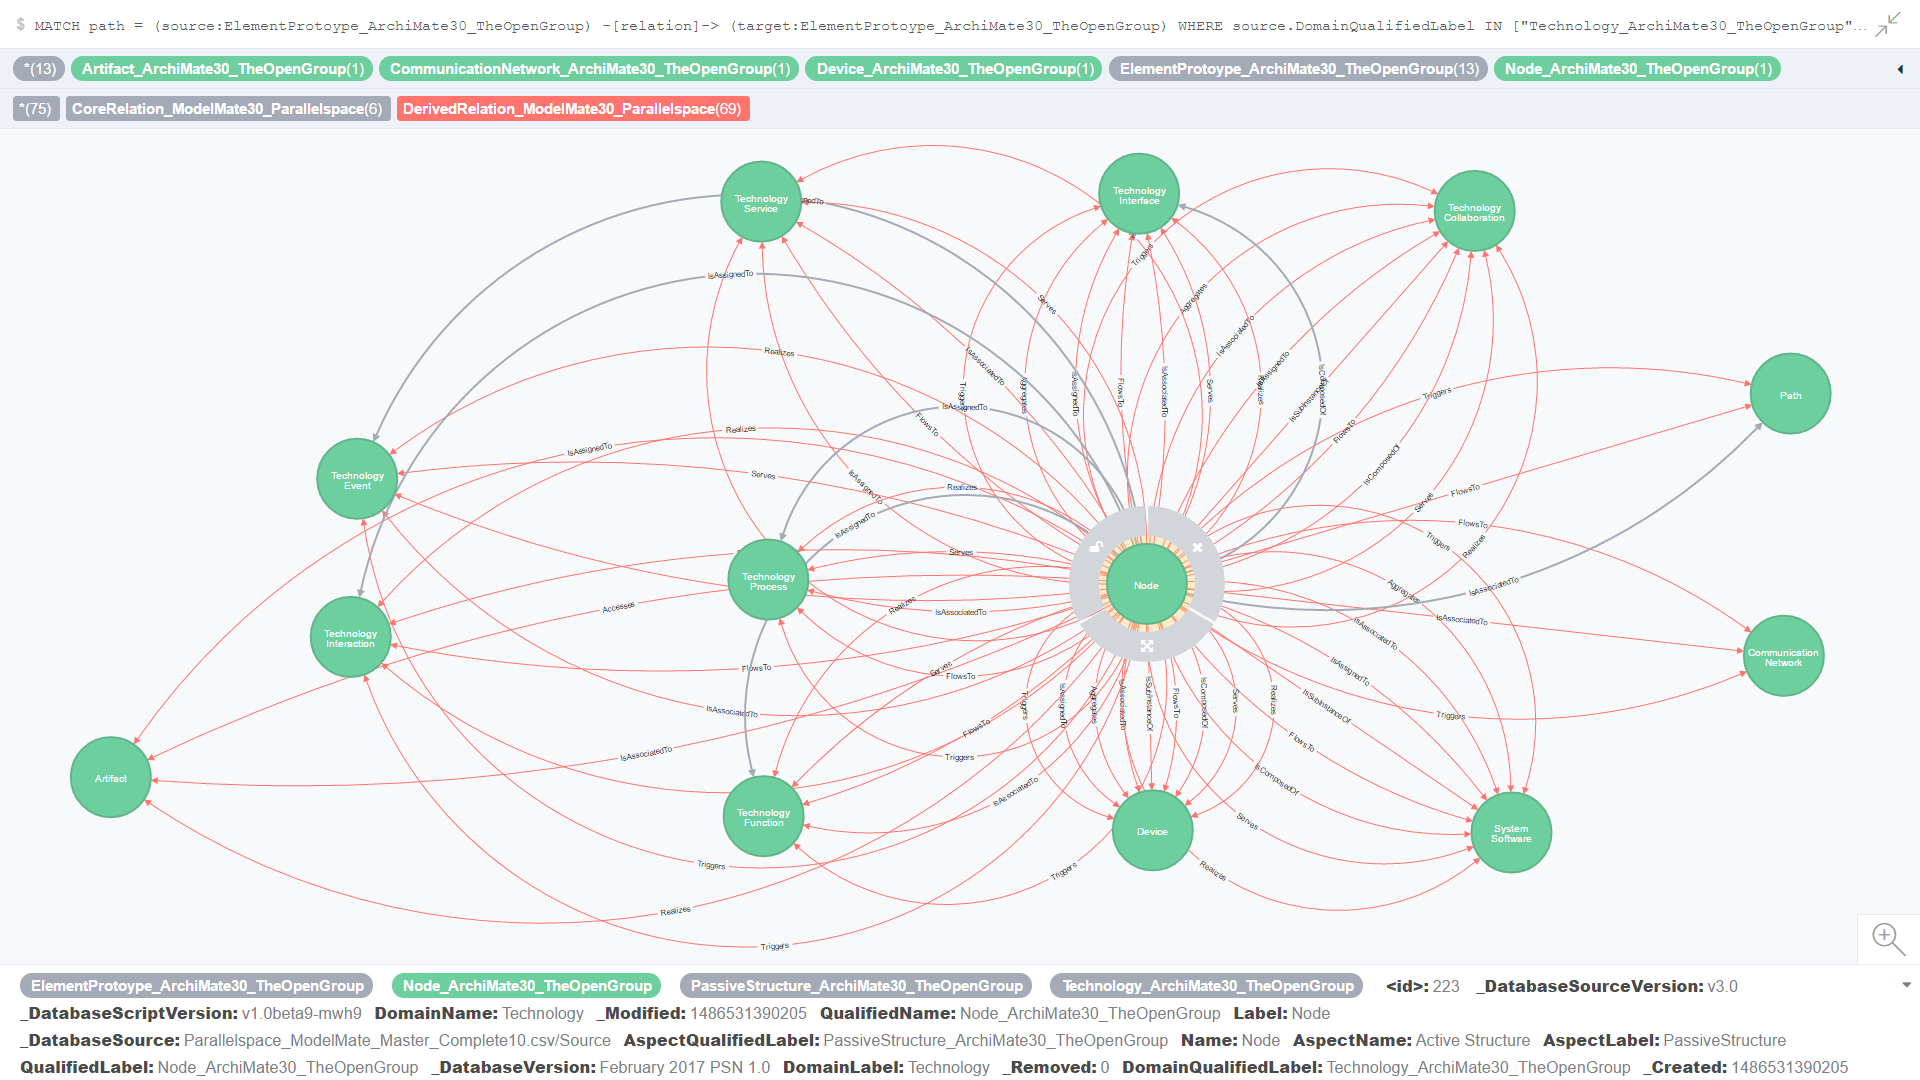
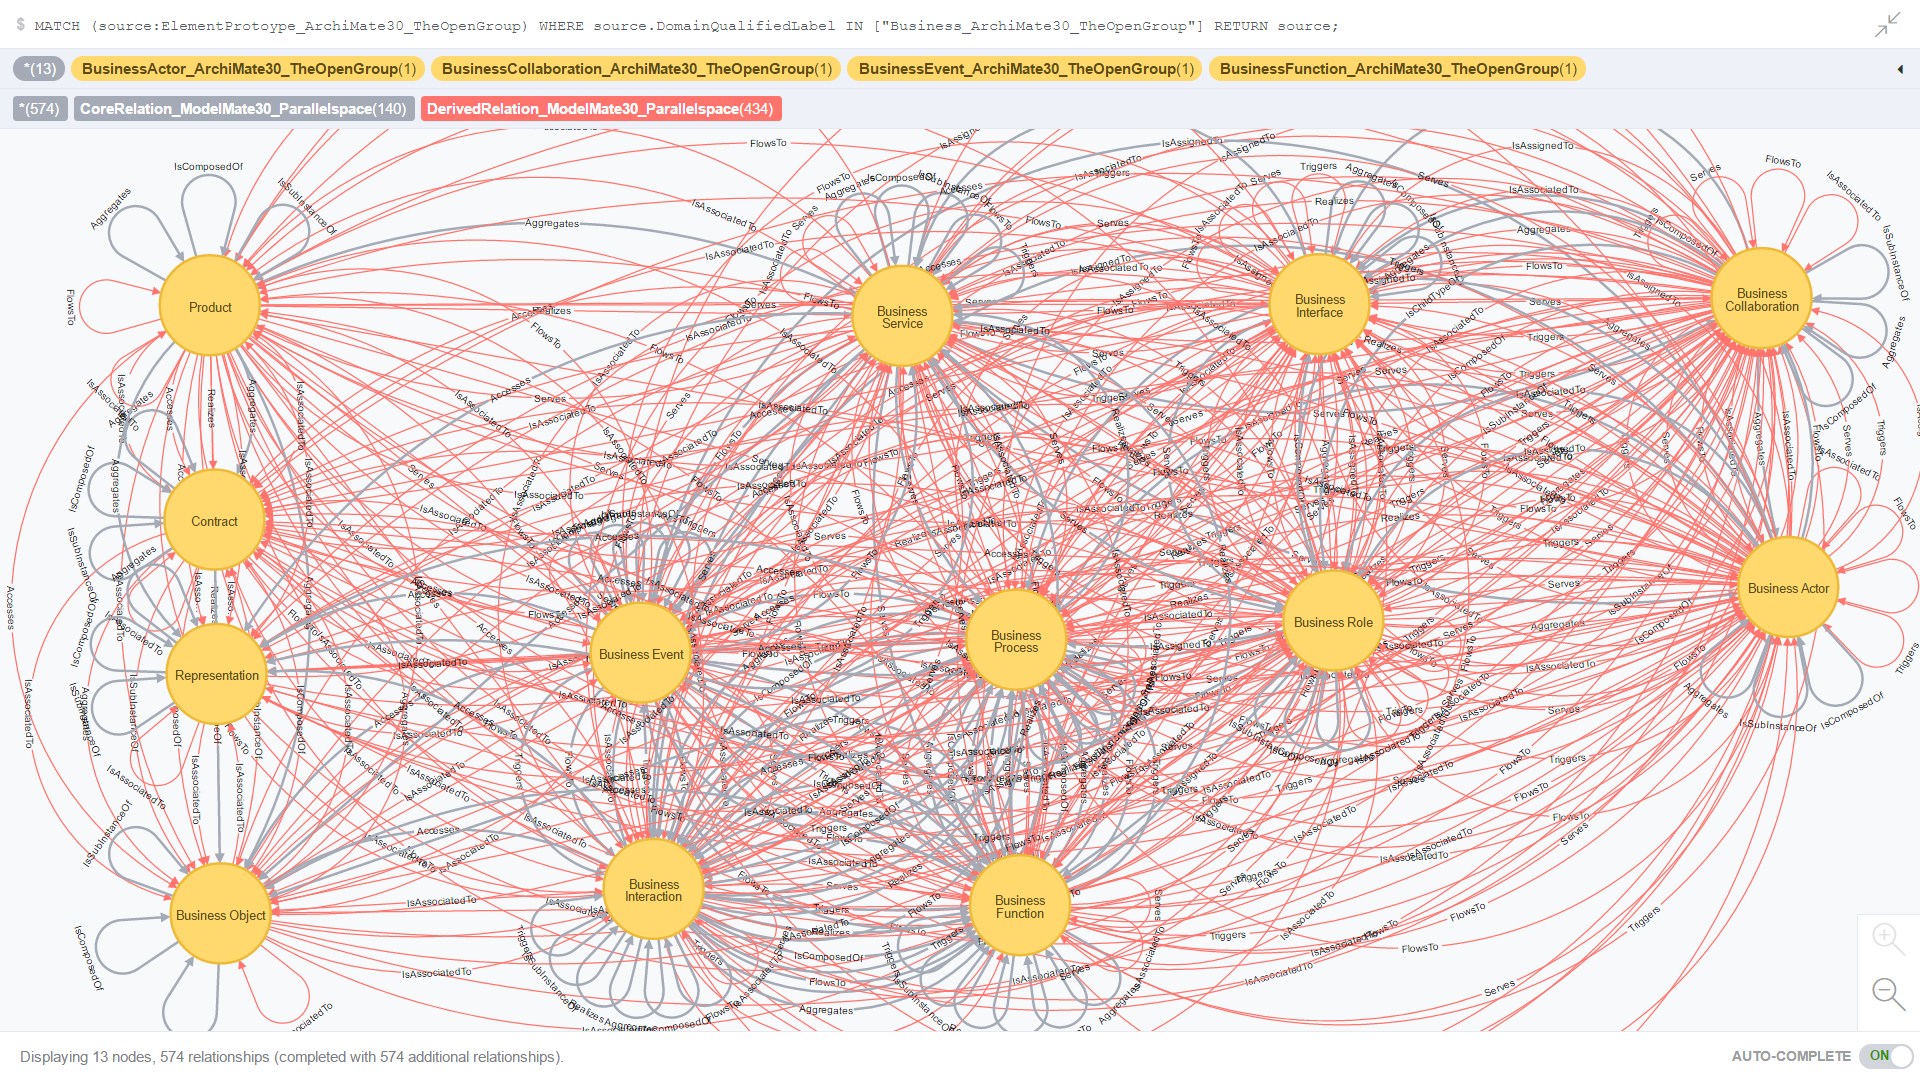
11. Parallelspace ModelMate
Parallelspace ModelMate is an approach (platform and language framework) for creating domain specific languages (DSLs) for enterprise architecture. It is realized using #Graphitization and the ArchiMate enterprise architecture modeling language.
References
- Crossing the Enterprise Architecture Chasm
- Crossing the EA Chasm: Open Repository Strategies for Enterprise Architecture
- ModelMate Architecture Reference Model
12. Internet of Things (IoT)
IoT is an interesting beast. It is a reference to an application service for processing raw events from a device or dynamically generated events from a software system. IoT also defines a conceptual software and data flow architecture that can also be used for the dynamic creating and maintenance of complex systems such as large enterprise architectures.
References
- Subject: MS Azure Services: Is there an overarching architectural vision?
- MS Azure is a bit of a bucket of bolts …very good bolts …but relative to the other IoT vendors, a bucket of bolts.
- Crossing the EA Chasm: “Where does IoT [Internet of Things] fit in?”
13. Architecture Reference Models (ARMs)
An ARM is easily modeled (and analyzed) using #Graphitization. SharePoint and Azure Stack are two good examples.
References
- ARMs for Model-Driven LOB apps: SharePoint 2013/SharePoint 2016 [Oct. 24, 2016]
- Microsoft Azure Stack POC Architecture Reference Model (ARM): ArchiMate Model – version 1-0-7 – April 30, 2016
General References
- Continuous Transformation and Transformative Change are key principles of the Total Enterprise Architecture Model (TEAM) (click here)
- To dig deeper, check out Graphitization of the Enterprise (click here)
- [Enterprise Architecture, Big Data, CRM, ERP, …] Tools and Methods Don’t Generate Business Value (click here)
- Crossing the EA Chasm: The Surveyor
Best regards,
Michael Herman
Enterprise Architect and Data Scientist
Parallelspace Corporation
M: 416 524-7702
E: mwherman@parallelspace.net
B: http://hyperonomy.com
L: https://www.linkedin.com/in/mwherman/recent-activity/posts/
Skype: mwherman2000
Living at the intersection of Enterprise Architecture, Enterprise Knowledge, and Data Science
- ArchiMate is registered trademark of The Open Group.