Tag Archives: Neo4j

#Graphitization of the Amazon Leadership Principles (introducing Personal Leadership Principle Maps) – Iteration 1

COPYRIGHT © 2016-2017 by Michael Herman, Toronto, Canada. All rights reserved.

PLEASE POST A COMMENT ABOUT WHY THIS PAGE IS IMPORTANT TO YOU.
This particular page is 1 of my top 5 most viewed pages (ever) and I’d like to understand why. Thank you!

[Click on any figure to enlarge it to its full, original size.]

The motivation and goals for Iteration 1 of this project are simple:

  1. Make the Amazon Leadership Principles visually more understandable and more memorable
  2. Introduce the concept of a Personal Leadership Principles Map where one’s personal career and personal belief system is mapped to each of the Amazon Leadership Principles
  3. Promulgate the use and application of #Graphitization beyond its traditional roots in Enterprise Architecture.

This article is structured as follows:

  • Appendix B – Amazon Leadership Principles is copy of the original text (non-graphitized) version of the Amazon Leadership Principles from the Amazon Jobs website.
  • Appendix A – Amazon Leadership Principles (and Subprinciples) contains an ArchiMate enterprise architecture model that depicts the (and then decomposes) the 14 Amazon Leadership Principles into multiple levels of subprinciples. Scroll down to the bottom of this article to check it out.
    NOTE: The underlining in Appendix A attempts to highlight the individual Subprinciples and Relationships found in the text description of each of the 14 Principles.
  • The first real section Amazon Leadership Principles, Core Entities, and Relationships presents a new innovative way to learn, remember, understand, and apply the Amazon Leadership Principles as highly visual web (or mesh or graph) of principles, concrete entities, abstract entities, and relationships.
  • The last section (just before Appendix A), entitled Personal Leadership Principle Maps, depicts how the experiences and accomplishments of one person’s career (mine) can be (formally) mapped the Amazon Leadership Principles.

Let’s start the journey. If you’re not familiar with the Principles, start by reading:

  • Appendix B – Amazon Leadership Principles; then
  • Appendix A – Amazon Leadership Principles (and Subprinciples)

All of the figures in this article represent different graphitized views of the Amazon Leadership Principles (click here) …all built from a single underlying graph model (which, in total, is referred to as the #Graphitization of the Amazon Leadership Principles).

Visually, the model is expressed using the ArchiMate 3.0 visual language standard for enterprise architecture. The model was built with the latest version of Archi 4.0, the open-source, free enterprise architecture modeling platform.

If you would like to work directly with the ArchiMate model for the Amazon Leadership Principles,

This article concludes with a list of possible Next Steps for Iteration 2.

Enjoy.

Amazon Leadership Principles, Core Entities, and Relationships

The text of the Amazon Leadership Principles references specific:

  • Roles
  • Concrete entities,
  • Abstract Entities, as well as, more importantly,
  • Relationships between these entities

These are collectively referred to as the Core Entities. Roles include:

  • Leader
  • Owner
  • Customer
  • Competitor
  • Partner
  • etc.

Concrete Entities include:

  • The Amazon Organization (presented by an employee directory or org chart)
  • Employee Team (same including virtual teams documented in project documents)
  • Standards (assuming they are written down or, in other words, documented)
  • Products
  • Services
  • Processes
  • etc.

Abstract Entities include:

  • Speed
  • Calculated Risks
  • Decisions
  • Actions
  • Inputs
  • Results
  • Bold Directions
  • Capabilities
  • etc.

Relationships include:

  • Leaders obsess over Customers
  • Leaders pay attention to Competitors
  • Leaders earn and keep Customer Trust
  • Constraints breed Resourcefulness
  • Constraints breed Self-Sufficiency
  • Constraints breed Invention
  • etc.

All of the entities and relationships are depicted in Figure 1 below (assuming none or only a few have been overlooked). (Click the figure to enlarge it.)

The entities and relationships were deduced by inspection and analysis of each of the 14 Amazon Leadership Principles (classic business analysis, more or less).

Parallelspace-Amazon Leadership Principles, Roles, and Relationships-P00-Core Entities v1.30

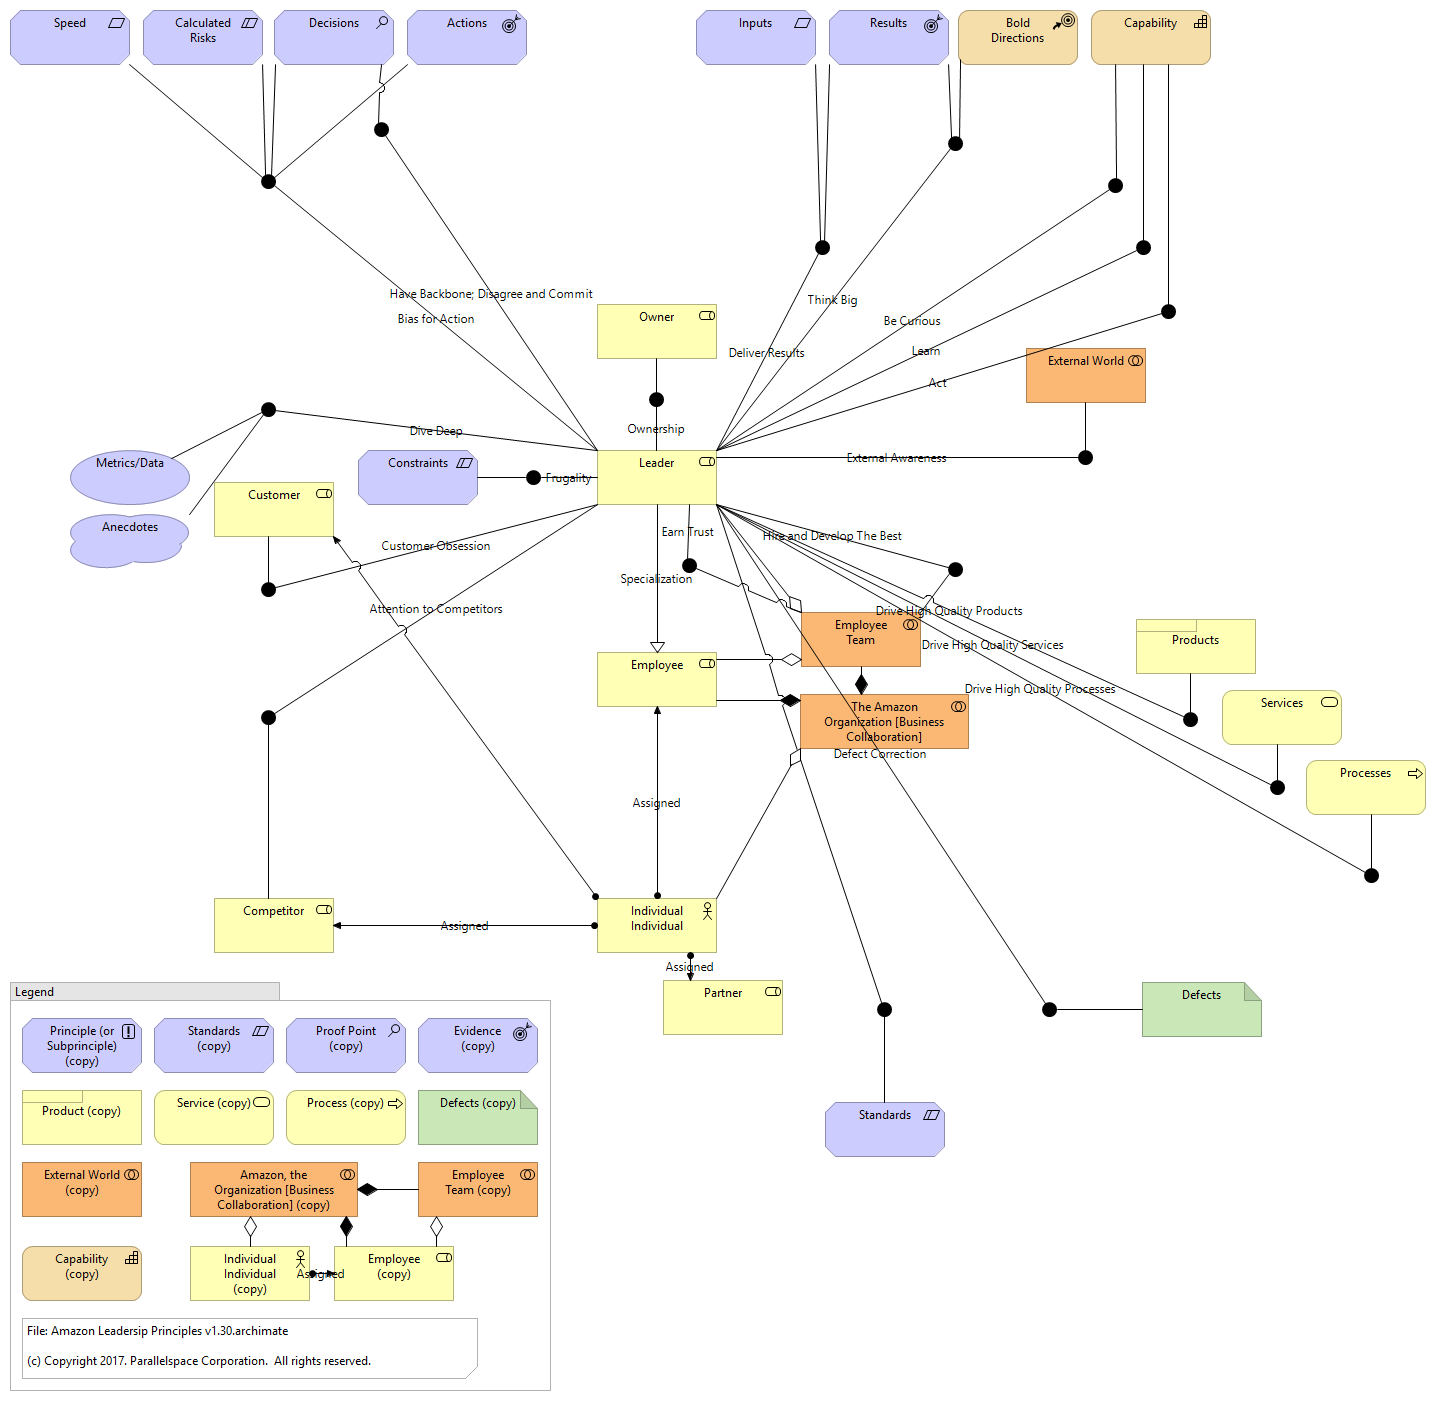
Figure 1. Amazon’s Principles, Core Entities, and Relationships: The Core Model

The existence, enablement, creation and/or execution of each group of relationships gives rise to (or realizes) one or more of the 14 Principles (and/or their Subprinciples). When these realization relationships are added to the Core Entities depicted in Figure 1,  Figure 2., the “Complete Model”, is the result. (Click to enlarge.)

Parallelspace-Amazon Leadership Principles, Roles, and Relationships-P00-All v1.30

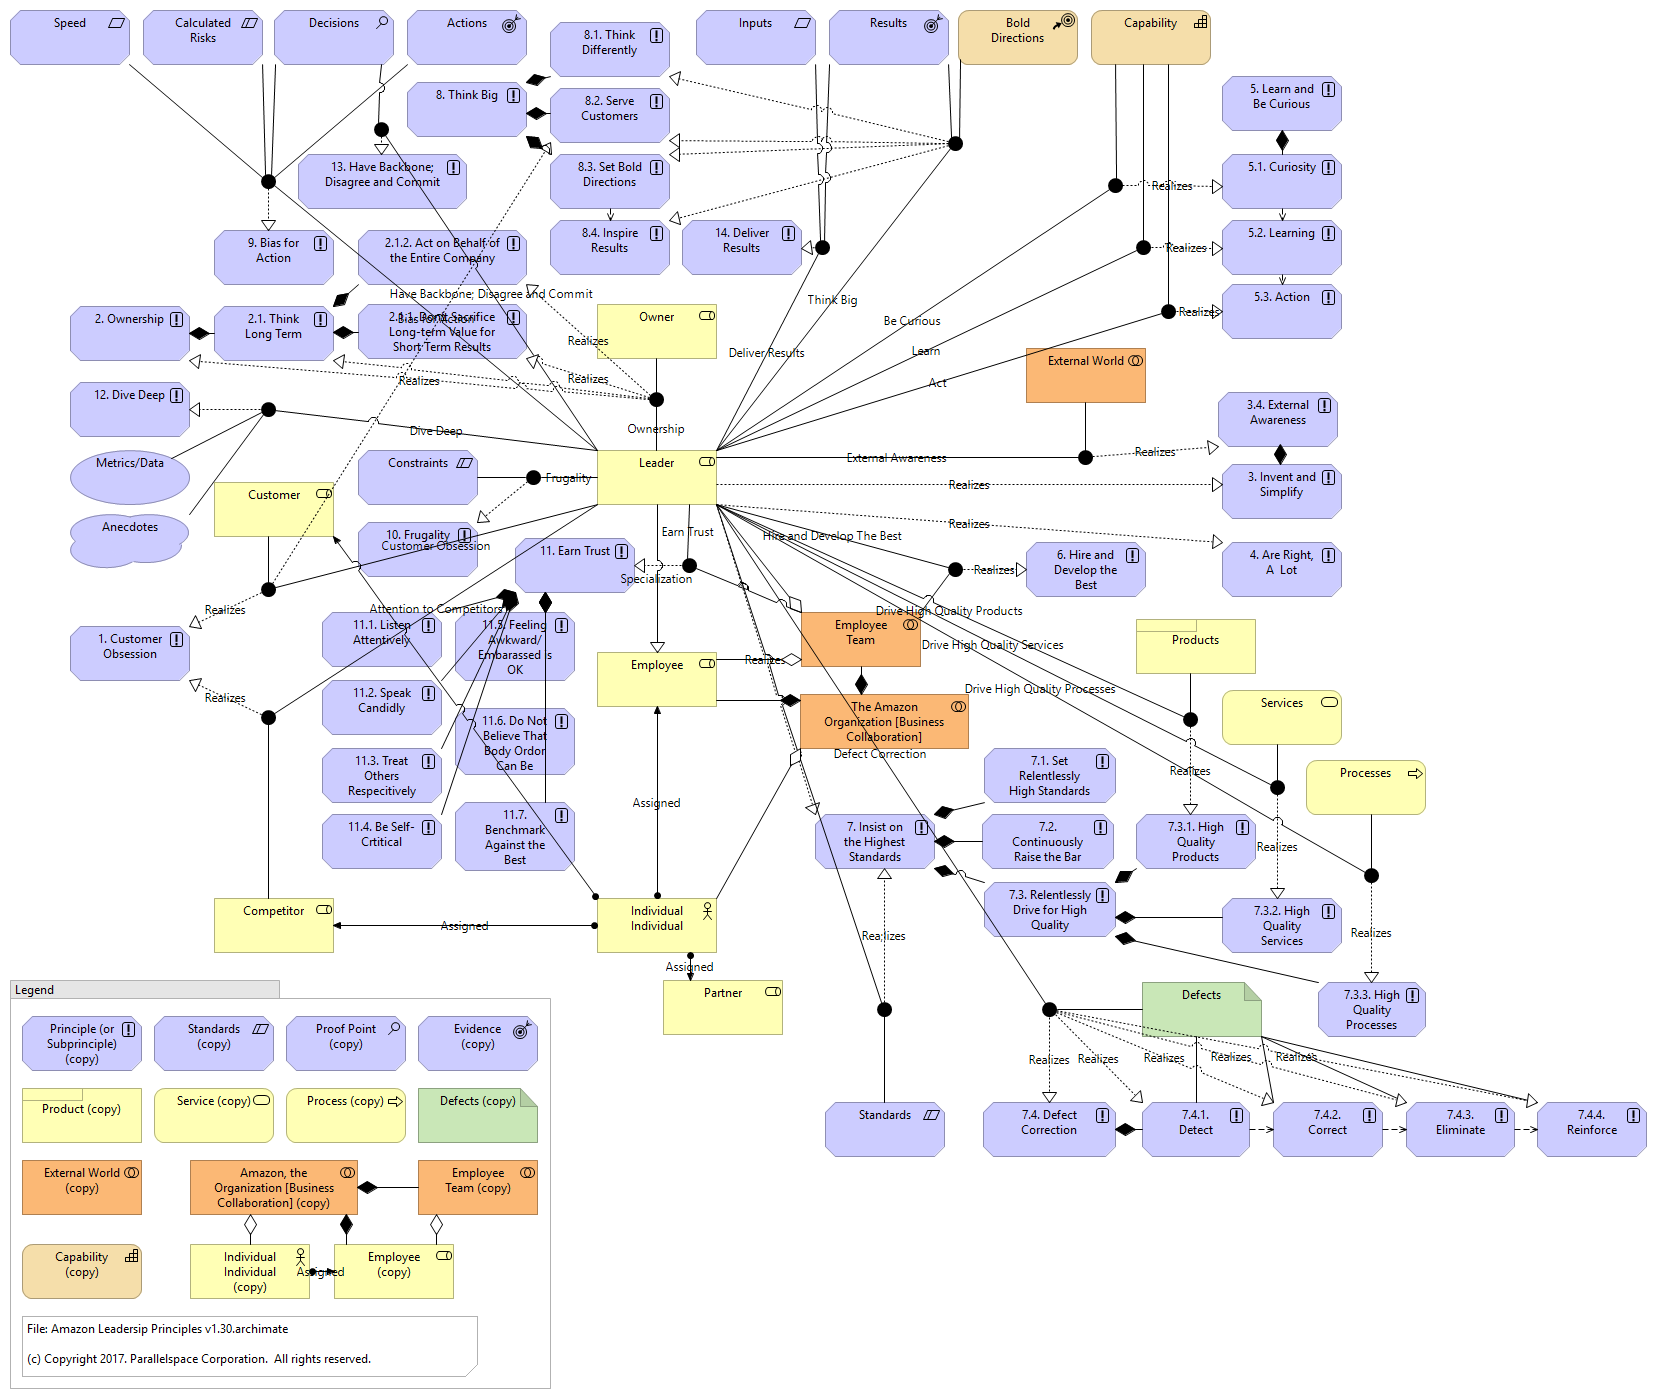
Figure 2. Amazon’s Principles, Core Entities, and Relationships: The Complete Model

To simplify the understanding of the model, 14 new views were created – one for each of the 14 Principles – each overlayed on the original Core Model (Figure 1). Figure 3 is an example drawn from one of these 14 views: Principle 1. Customer Obsession.

Parallelspace-Amazon Leadership Principles, Roles, and Relationships-P01 v1.30

Figure 3. Amazon’s Principles, Core Entities, and Relationships: Principle 1. Customer Obsession

Located in the lower-left side of Figure 3, the Customer Obsession Principle is realized by:

  • a) a Leader’s focus or “obsession over Customers”, and
  • b) a Leader’s “attention to the Competition”.

Figure 4. below is an animation of the Complete Model overlayed, principle-by-principle, against the Core Model.

This slideshow requires JavaScript.

Figure 4. Amazon’s Principles, Core Entities, and Relationships: Principle-by-Principle Animation overlayed against the Core Model

The individual views of the 14 Amazon Leadership Principles can be downloaded from here: https://www.facebook.com/mwherman/media_set?set=a.10155018158800932.1073741988.635655931&type=3.

So far, we’ve addressed the “what” of the Amazon Leadership Principles depicted as a #Graphitization model projected as a number of different views.

In the next section, the Amazon Leadership Principles are used as a framework for cataloging one’s lifetime experiences and accomplishments. Personal Leadership Principle Maps is an Amazon Leadership Principles application – it’s the Amazon Leadership Principles put into action.

Personal Leadership Principle Maps

Have you been living an Amazon Leadership Principled career/faith/life?

Figure 5. is a copy of my Personal Leadership Principle Map (PLPM).

  • ArchiMate Assessment entities are used to model specific experiences and accomplishments.
  • ArchiMate Outcome entities are used to model specific evidence, learnings, or proof that one has been able to apply the specific principle in their career, faith and/or life.

Parallelspace-Amazon Leadership Principles-Personal Leadership Principle Map-Michael Herman v1.30

Figure 5. Amazon’s Principles: Michael’s Experiences and Accomplishments

In my case, for Principle 7. Insist on the Highest Standards, I have specific experiences related to the recent Toronto Salesforce 2017 Tour, working at Parallelspace Corporation, the IBM Canada Toronto Software Lab, and at Microsoft.

Specific evidence includes:

  • Parallelspace trust framework (Relationships-Reputation-Trust)
  • Working as an ISO-9000 Quality Analyst and a certified Quality Assurance Auditor
  • A concept I call focusing on the success of an Individual Individual
  • Various and diverse experiences working for Microsoft as a full-time employee (blue badge) and as a Microsoft partner

Next Steps for Iteration 2

Possible next steps include:

  • Federation of Personal Leadership Principle Maps – at the Employee Team, business unit, or Organization level to discover the aggregates collective experiences and accomplishments for the purpose of rebalancing hiring objectives (Principle Gap Analysis), accumulating customer as well as competitive intelligence, etc. to support Customer Obsession, Ownership, Invent and Simplify, etc. goals and objectives. Identifying the best sources of experiences and accomplishments for specific Principles based on a Team’s or Organization’s previous roles, education, or training.
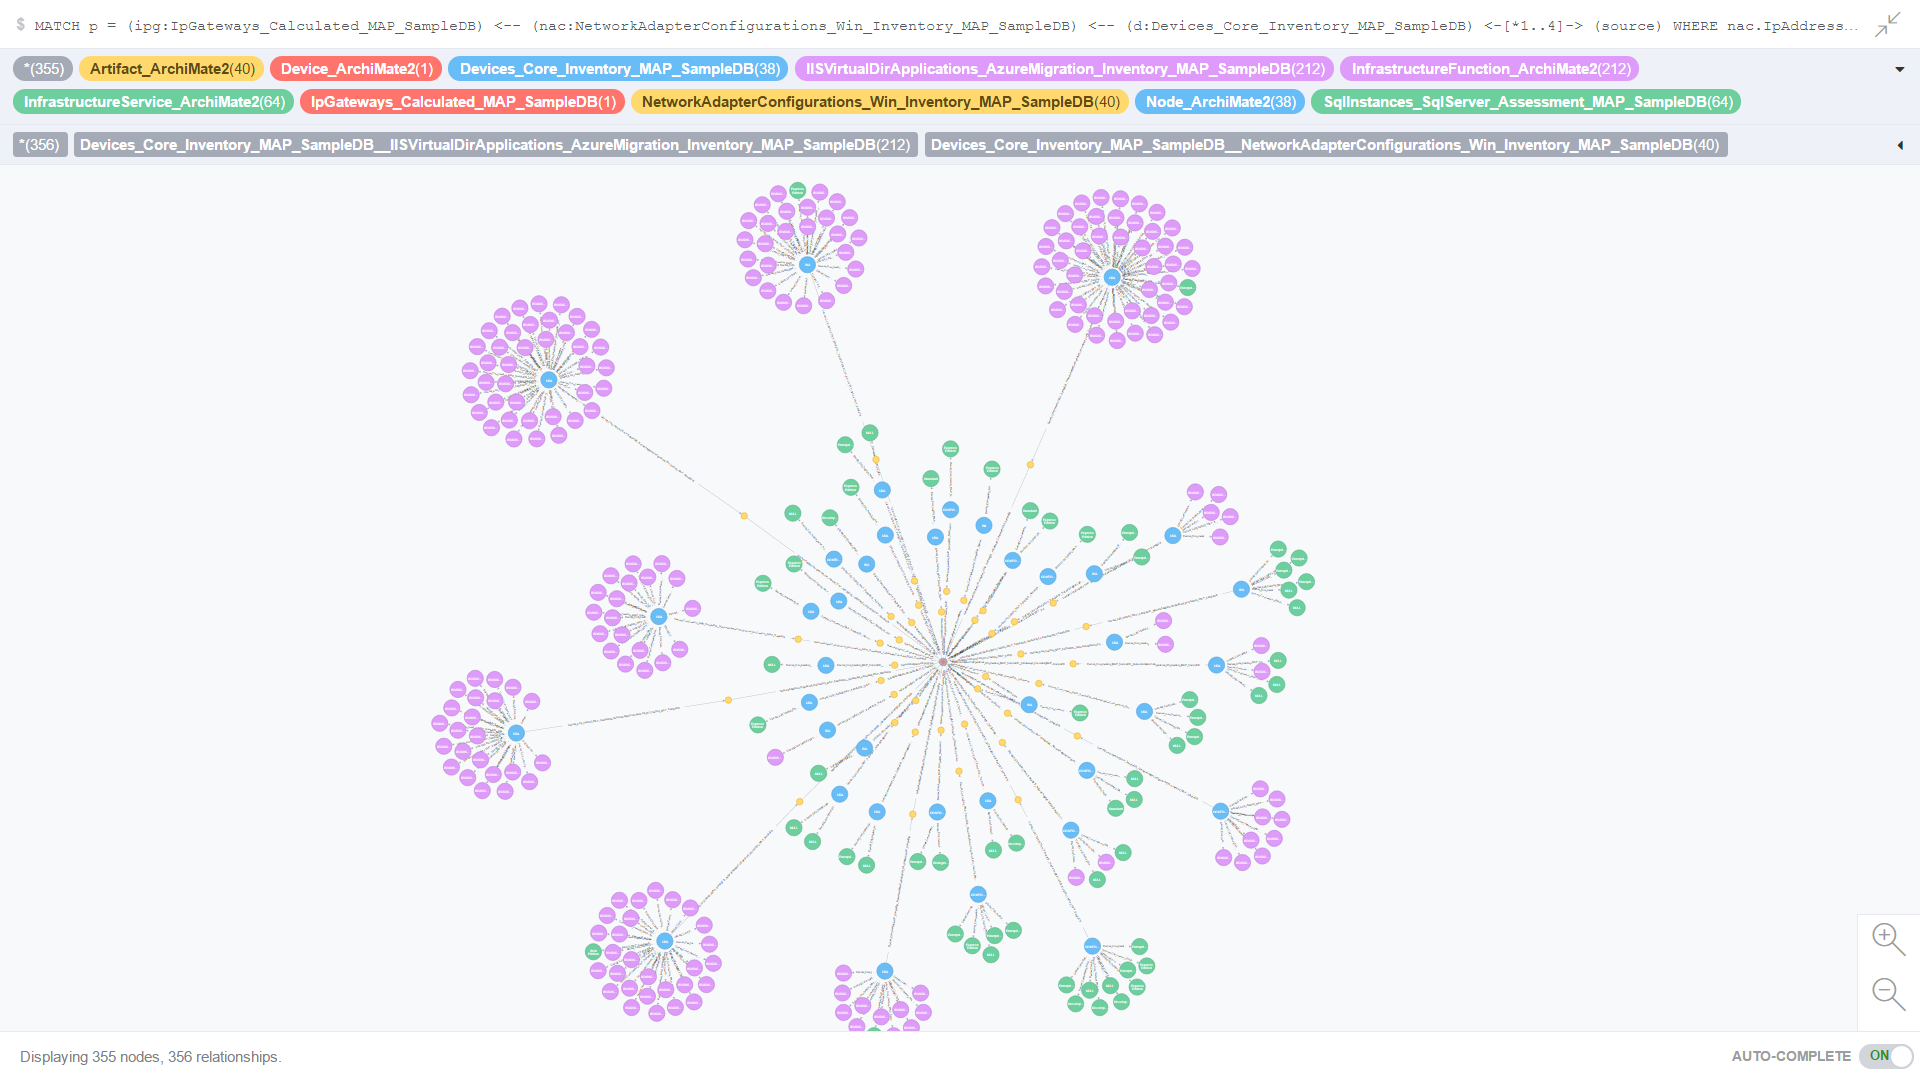
  • Use of both the Core Model and the Complete Model as well as the Federate Personal Leadership Principle Maps to create a graph database repository to real-time query analysis and visualization (e.g. using the Neo4j graph database).
  • To support Amazon’s operational data analysis needs (e.g. Amazon Marketplace 3rd Party Retail Data).
  • Apply the Parallelspace principles

References

  1. Continuous Transformation and Transformative Change are key principles of the Total Enterprise Architecture Model (TEAM) (click here)
  2. To dig deeper, check out Graphitization of the Enterprise (click here)
  3. [Enterprise Architecture, Big Data, CRM, ERP, …] Tools and Methods Don’t Generate Business Value (click here)

Appendix A – Amazon Leadership Principles (and Subprinciples)

Below is an ArchiMate enterprise architecture model that depicts (and then decomposes) the 14 Amazon Leadership Principles into multiple levels of subprinciples (as appropriate/as required).

These are based on the text-based defintions of the 14 Principles found in Appendix B – Amazon Leadershp Principles.

Parallelspace-Amazon Leadership Principles (and Subprinciples) v1.30

Figure 6. Amazon’s Principles (and Subprinciples)

Appendix B – Amazon Leadership Principles

The following Leadership Principles are taken directly from the Amazon Jobs website.

  • The sequential numbering (in parenthesis) was added by me.
  • The underlining attempts to highlight the individual Subprinciples and Relationships found in the text description of each of the 14 Principles.

Leadership Principles

Our Leadership Principles aren’t just a pretty inspirational wall hanging. These Principles work hard, just like we do. Amazonians use them, every day, whether they’re discussing ideas for new projects, deciding on the best solution for a customer’s problem, or interviewing candidates. It’s just one of the things that make Amazon peculiar.

Customer Obsession (1)

Leaders start with the customer and work backward. They work vigorously to earn and keep customer trust. Although leaders pay attention to competitors, they obsess over customers.

Ownership (2)

Leaders are owners. They think long term and don’t sacrifice long-term value for short-term results. They act on behalf of the entire company, beyond just their own team. They never say “that’s not my job”.

Invent and Simplify (3)

Leaders expect and require innovation and invention from their teams and always find ways to simplify. They are externally aware, look for new ideas from everywhere, and are not limited by “not invented here”. As we do new things, we accept that we may be misunderstood for long periods of time.

Are Right, A Lot (4)

Leaders are right a lot. They have strong judgment and good instincts. They seek diverse perspectives and work to disconfirm their beliefs.

Learn and Be Curious (5)

Leaders are never done learning and always seek to improve themselves. They are curious about new possibilities and act to explore them.

Hire and Develop the Best (6)

Leaders raise the performance bar with every hire and promotion. They recognize exceptional talent and willingly move them throughout the organization. Leaders develop leaders and take seriously their role in coaching others. We work on behalf of our people to invent mechanisms for development like Career Choice.

Insist on the Highest Standards (7)

Leaders have relentlessly high standards – many people may think these standards are unreasonably high. Leaders are continually raising the bar and driving their teams to deliver high-quality products, services, and processes. Leaders ensure that defects do not get sent down the line and that problems are fixed so they stay fixed.

Think Big (8)

Thinking small is a self-fulfilling prophecy. Leaders create and communicate a bold direction that inspires results. They think differently and look around corners for ways to serve customers.

Bias for Action (9)

Speed matters in business. Many decisions and actions are reversible and do not need extensive study. We value calculated risk taking.

Frugality (10)

Accomplish more with less. Constraints breed resourcefulness, self-sufficiency, and invention. There are no extra points for growing headcount, budget size or fixed expense.

Earn Trust (11)

Leaders listen attentively, speak candidly, and treat others respectfully. They are vocally self-critical, even when doing so is awkward or embarrassing. Leaders do not believe their or their team’s body odor smells of perfume. They benchmark themselves and their teams against the best.

Dive Deep (12)

Leaders operate at all levels, stay connected to the details, audit frequently, and are skeptical when metrics and anecdote differ. No task is beneath them.

Have Backbone; Disagree and Commit (13)

Leaders are obligated to respectfully challenge decisions when they disagree, even when doing so is uncomfortable or exhausting. Leaders have conviction and are tenacious. They do not compromise for the sake of social cohesion. Once a decision is determined, they commit wholly.

Deliver Results (14)

Leaders focus on the key inputs for their business and deliver them with the right quality and in a timely fashion. Despite setbacks, they rise to the occasion and never settle.

Best regards,

Michael Herman
Enterprise Architect and Data Scientist
Parallelspace Corporation
M: 416 524-7702
E: mwherman@parallelspace.net
B: http://hyperonomy.com
L: https://www.linkedin.com/in/mwherman/recent-activity/posts/
Skype: mwherman2000

Living at the intersection of Enterprise Architecture, Enterprise Knowledge, and Data Science

3 Comments

Filed under ArchiMate, Architecture Reference Models, Business Value, continuous transformation, Definitions, Enterprise Architecture, graph database, Graphitization, How do we think, ModelMate, Process, Product Management, Uncategorized

#Graphitization of Ray Dalio’s Principles: Iteration 2

COPYRIGHT © 2016-2017 by Michael Herman, Toronto Canada. All rights reserved.

This article is the third in a series on #Graphitization. Click here to explore the other articles in this series.

Iteration 2 is a small iteration that had a goal of improved key phrase-based exploration and visualization of The Principles of Ray Dalio.  This iteration builds on the ModelMate model of The Principles described earlier in this series: #Graphitization of Ray Dalio’s Principles: Iteration 1 and represents a significant improvement in terms of understanding which principles are realized by specific combinations of key phases.

Iteration 2 uses the same query used in Iteration 1. This time, the Linkurious graph visualization app is used to display the subgraph of all Topics, Principles, Subprinciples, Commentary, Questions, etc. directly or indirectly related to the key phrases “radically” and “transparent”. This concept is represented by the following simple query:

MATCH path =
 (pub:Publication_Principles_RayDalio_ModelMate)-[*]->(principle)
 -[r:HAS_KEYPHRASE]->(phrase:KeyPhase_Principles_RayDalio_ModelMate)
 WHERE phrase.Phrase CONTAINS "radical"
 OR phrase.Phrase CONTAINS "transparen"
 RETURN path;

The Principles subgraph containing all elements that are directly or indirectly related to the key phrases “radically” and “transparent” is shown below (click to enlarge).

ModelMate-Ray-Dalio-Radically Transparent.png

Figure 1. All Topics, Principles, Subprinciples, etc. with Traceability to the Key Phases “radically” and “transparent”

The underlying graph is implemented using the ModelMate framework and implemented using the Neo4j graph database.

Best regards,

Michael Herman (Toronto)
Parallelspace Corporation
mwherman@parallelspace.net

7 Comments

Filed under Automated Enterprise Architecture Modeling, continuous transformation, Data Science, Graphitization, How do we think, ModelMate, Progressive Enterprise Architecture Map (PEAM)

#Graphitization of Ray Dalio’s Principles: Iteration 1

COPYRIGHT © 2016-2017 by Michael Herman, Toronto Canada. All rights reserved.

[If you “only want to see the pictures”, scroll down to Figure 4.]

This article is the second in a series on #Graphitization. Click here to explore the other articles in this series.

Background

ray-dalioRay Dalio is Chairman & Chief Investment Officer at Bridgewater Associates, L.P., the world’s largest hedge fund, and is well known for The Principles that he and his colleagues at Bridgewater use to govern themselves and each other. Mr. Dalio has published the 200+ Principles in a 123-page document and made the content publically available on a dedicated website: Principles by Ray Dalio (“The Principles”). Here is his description of The Principles…

“What is written here is just my understanding of what it takes: my most fundamental life principles, my approach to getting what I want, and my “management principles,” which are based on those foundations. Taken together, these principles are meant to paint a picture of a process for the systematic pursuit of truth and excellence and for the rewards that accompany this pursuit. I put them in writing for people to consider in order to help Bridgewater and the people I care about most.”

I encourage you to read more of his Introduction here.

What is #Graphitization?

#Graphitization is a data science and enterprise architecture framework and process model for modeling, ingesting, organizing, analyzing, and visualizing any domain of endeavor by using graphs – networks of connected objects and relationships with each object and relationship annotated with additional descriptive information (metadata).

The primary applications of #Graphitization are:

  • System optimization,
  • Systems life cycle management, and
  • Transformative Change in resulting in positive increases in business value for the system being studied.

A system is defined as any collection of strategies, system components, assets, architectures or processes.

In the article #Graphitization of the Enterprise, I’ve provided a number of illustrations of how one field of endeavor, the continuous transformation of large enterprise organizations, can benefit from #Graphitization. My blog contains several additional examples of #Graphitization applied to traditional enterprise architecture; for example, Crossing the EA Chasm: Automating Enterprise Architecture Modeling #2.

Why not try applying #Graphitization to something completely different?

#Graphitization of Ray Dalio’s Principles

A few weeks ago (December 22, 2016), the Wall Street Journal published an article (The World’s Largest Hedge Fund Is Building an Algorithmic Model From its Employees’ Brains) which describes Mr. Dalio’s vision for creating “The Book of the Future.”

“One employee familiar with the project described it as “like trying to make Ray’s brain into a computer.””

2 + 2 = ?  You guessed it. Why not try to graphitize part of Mr. Dalio’s brain?

That is, why not try to turn The Principles into a computer model that documents each Principle, its hierarchical inter-relationships, and, via some sophisticated cloud-based text analysis services, visualize all of the important interconnections based on a set of computer-chosen key phrases?

This article documents Iteration 1 of the #Graphitization of Ray Dalio’s Principles.

Wisdom in, Wisdom out

Today, there are several easy-to-use technologies that enable developers to view web pages as sophisticated databases.  The Principles website (a single web page) is no exception.

A simple query like the one below makes it is easy to exact the hierarchy of Sections, Topics, Principles, Subprinciples, Summary Paragraphs, Questions, Bullets, Figures, etc. from The Principles using a single statement.

modelmate-ray-dalio-html-query

Figure 1. The Principles Web Page Query

A sample portion of The Principles web page appears below and has the following structure:

  • “To Get The Culture Right…” is a Section. There are 4 Sections at the top level of the Publication.
  • “TRUST IN TRUTH” is a Topic and it is also a numbered Principle.
  • “Realize that you have nothing to fear from truth.” is a numbered Principle.
  • Principles can contain numbered Subprinciples.
  • Topics, Principles, and Subprinciples can have (unnumbered) Summary Paragraphs, Questions, Bullets, Figures, etc.

Topics, Principles, and Subprinciples are numbered sequentially; there is no hierarchical numbering scheme.

Ray-Dalio-Principles-radically-transparent-web.png

Figure 2. Web Page Sample: The Principles By Ray Dalio

In my ModelMate model for The Principles, 3 classes of key phrases are used to cross-index each Topic, Principle, Subprinciple, etc.

  1. Key Topics – short phrases deemed to be particularly relevant and interesting across the entire document (i.e. the corpus)
  2. Key Phrases – short phrases deemed to be of particular importance within the scope of a single title, paragraph of text, question, or bullet.
  3. Other Phrases – additional key phrases chosen because they are particularly relevant to Bridgewater, Mr. Dalio, and The Principles.

In total, there are 2470 key phases; about 200 of these are Key Topics selected by a cloud-based text analytics service, about 300 are Other Phases. The remaining Key Phrases (with a few overlaps) were selected by a different text analytics service that was run against the text of each individual Topic, Principle, Subprinciple, etc.

A sample of the ingested The Principles web page content looks like the following (click to enlarge):

exampledata-keyphrases

Figure 3. Ingested Web Page

Results of Iteration 1

The entire structure and content of The Principles was ingested during Iteration 1 of this project:

  • 210 principles comprised of 768 artifacts (titles, paragraphs, questions, bullets, …)
  • 767 structural relationships
  • 2470 key phrases
  • 6126 key phrase-principle semantic relationships

The sample queries below highlight The Principles that are related to 2 critically important concepts at Bridgewater: “radically” and “transparent” (including all words that have these words as reasonable root words).

The single line queries found all artifacts that were in some way related to the 2 key phases; then calculated the traceability up to through to the top (beginning) of The Principles (click to enlarge).

ray-dalio-principles-radically-transparent

Figure 4. All Topics, Principles, Subprinciples, etc. with Traceability to the Key Phases “radically” and “transparent”

The large orange dot represents the top (the root of the web page). The large blue dots represent the 4 top-level Sections in The Principles:

  • To Get the Culture Right…
  • To Get the People Right…
  • To Perceive, Diagnose, and Solve Problems…
  • To Make Decisions Effectively…

The green dots are Topics; the red dots are Principles; and, the purple dots are Subprinciples. Key Phrases appear as pink dots.  The gray dots are Commentary Paragraphs, Questions, Bullets, Figures, etc.

Figure 5 (below) includes some exploration (expansion) of Principal 2. Realize that you have nothing to fear from truth.

ray-dalio-principles-radically-transparent-plus

Figure 5. Principal 2. Realize that you have nothing to fear from truth.

Conclusions

In the end, extending the ModelMate platform to support the above produced more learning than what I’ve been able to glean from subsequent exploration of the #Graphitization of The Principles. Perhaps someone with more familiarity with The Principles can contact me with some interesting use cases. I’m extremely curious to derive more value from this model

This work on this project was made infinitely easier through the use of the ModelMate platform (powered by the Neo4j graph database).

To see a more meaningful visualization of The Principles, check out #Graphitization of Ray Dalio’s Principles: Iteration 2.

Best regards,

Michael Herman (Toronto)
Parallelspace Corporation
mwherman@parallelspace.net

7 Comments

Filed under Automated Application Architecture Analysis, Business Value, Data Science, Graphitization, How do we think, ModelMate, Progressive Enterprise Architecture Map (PEAM), The Principles

Crossing the EA Chasm: ArchiMate “Keep Calm and Have IT Your Way”

archimate-have-it-your-way

What would the nirvana of “Have IT Your Way” EA actually look and feel like?

First, a bit of required pre-reading: check out Crossing the EA Chasm: Re-visioning the ArchiMate Specification.

My apologies if you haven’t already read the preceding article. It was part of an initial draft of this article until I realized the topic of ArchiMate customization needed to stand on its own.  It became the main course; leaving this article to be the dessert and, hence, much more enjoyable.

This article consists of alternate visualizations of the same underlying ModelMate enterprise architecture model and, for the most part, the same view.  The only variables are the modeling scheme and zoom factor used to render each view:

  • Colored dots
  • ArchiMate iconography
  • Microsoft Enterprise Viso Stencil
  • Amazon Web Services (AWS) 2D iconography
  • Amazon Web Services (AWS) 3D iconography

The first figure is an animation/slide show. It depicts a succession of views – each drawn with one of the above schemes.

This slideshow requires JavaScript.

Figure 1. Single Open EA Repository: “Have It Your Way” Views
(Dots, ArchiMate, Microsoft Enterprise Stencil, AWS 2D Icons, AWS 3D Icons)

Zoom factor is an interesting variable. In the first 2 frames of the above animation, the transition from the large scale view using the “dots” scheme to the smaller scale view using the ArchiMate scheme is one example of how different schemes can benefit from being used together in the same view. In this example, it’s the benefit of masking the detail in large scale views while allowing the detail to be unwrapped in small scale views. The benefit is more esthetically pleasing and understandable views for each range of zoom factors.

parallelspace-modelmate-archimate-detail

Figure 2. ArchiMate Icons: View Detail
(same underlying ModelMate model)

Figure 2 renders the view using the ArchiMate scheme, primarily. In addition, the colors of the dots denote the combination of schemes that are available in this ModelMate model. The top color of each dot denotes the ArchiMate element type and the bottom color denotes the element type based on a fine-grained Microsoft enterprise schema/taxonomy. For example, the highlighted component is a SQL Server Instance (denoted by the dark gray color in the top half of the dot). The yellow-green color (aided by the icon) identify the component as an ArchiMate infrastructure service. (Click on Figure 2 to enlarge it.)

parallelspace-modelmate-microsoft-detail

Figure 3. Microsoft Enterprise Visio Icons: View Detail
(same underlying ModelMate model)

Figure 3 is a similar view to Figure 2 but the Microsoft Enterprise Visio Stencil is used as the primary scheme. The pink color of the selected component denotes that it is an IP Subnet; the dark purple, an ArchiMate Network element. (Click on Figure 3 to enlarge it.)

parallelspace-modelmate-aws3d-detail

Figure 4. Amazon Web Services (AWS) 3D Icons: View Detail
(same underlying ModeMate model)

Figure 4 is virtually identical to Figure 3 except the AWS 3D set of icons is used as the primary scheme for rendering this view. (Click on Figure 4 to enlarge it.)

Each of these visualizations was rendering using the Linkurious graph visualizer running against a ModelMate model materialized in a Neo4j graph database.

Next Steps

More nirvana? Being able to see multiple schemes, side-by-side and interconnected at the same time rendered in a single view (e.g. ArchiMate for on-premise, AWS and/or Azure schemes used for the cloud, MS SharePoint stencil for the SharePoint information architecture, etc.). “More news at 11…”.

The Aperitif

Lastly and simply for your humor, I offer the following cartoon as the aperitif.

eamadeeasy

Figure 5. “Enterprise Architecture Made Easy”
Credit: Geek&Poke

Have IT Your Way.

Best regards,
Michael Herman (Toronto)
Parallelspace Corporation

mwherman@parallelspace.net

*ArchiMate is a registered trademark of The Open Group.

5 Comments

Filed under ArchiMate, Automated Application Architecture Analysis, Automated Enterprise Architecture Modeling, Crossing the EA Charm, Enterprise Architecture, ModelMate, Progressive Enterprise Architecture Map (PEAM)

Crossing the EA Chasm: Automating Enterprise Architecture Modeling #2

[Updated November 6, 2016: Added Database/Web Services Farm Example #2]

In the previous article Crossing the EA Chasm: Automating Enterprise Architecture Modeling, I included a simple example of how a current state enterprise architecture model can be created and maintained automatically.

The same ModelMate enterprise architecture model has now been extended to include a total of 832,789 ArchiMate entities connected by 828,859 relationships (with several million property values) and was created automatically from scratch in about 15 minutes.

Database/Web Services Farm Example #1 (Single Subnet)

Below is a simple example of an automatically generated view depicting the database services and web services configured on the 38 servers connected to a particular IP subnet.  There’s a total of 355 nodes in this accurate and up-to-date current state view. (Click the image to enlarge it)

parallelspace-modelmate-web-database-server-farm1

Figure 1. Database/Web Services Farm Example #1 (Single Subnet)

Pretty cool. The green dots are database services (SQL Server instances to be exact – almost every possibly product edition can be found in this subnet: SQL Server Express, Developer, Enterprise, Datacenter, etc.) modeled as Infrastructure Services; the blue dots, servers (Windows physical and virtual servers) modeled as Infrastructure Nodes; and, the purple dots, web servers (IIS virtual directory applications to be exact) modeled as Infrastructure Functions.

The small orange dots represent the network adapter configurations of the network adapters configured into each server.  The most central dot is the IP gateway (network router) for this subnet.

Database/Web Services Farm Example #2 (All Subnets/All Farms)

Parallelspace ModelMate-Web-Database Server Farms2.png

Figure 2. Database/Web Services Farm Example #2 (All Subnets/All Farms)

The red dots are IP subnets (32 in this ModelMate view) connecting 208 server Nodes that host either a SQL Server Instance (376 Infrastructure Service elements) and/or an IIS Virtual Directory Application (1597 Infrastructure Function elements).  The small orange dots are network adapter configurations. (Click the image to enlarge it)

Microsoft Exchange Server Farm Example

Here’s one more example of an auto-generated view from the same ModelMate model: a Microsoft Exchange email, collaboration, and unified communications services farm. In this view, the blue dots are the Windows Services running on each of these 3 Windows Servers in this view (out of a total of 5 servers in the complete farm). The orange dot highlighted in gray near the top of the server on the right side, for example, is an IIS virtual directory application that is hosting an Outlook Web Access (OWA) web service. (Click the image to enlarge it)

Parallelspace ModelMate-Exchange Server Farm.png

Figure 3. Microsoft Exchange Server Farm Example

The larger red entity contains all of the descriptive information (metadata) for each server’s processor; the smaller red dot, the memory configuration for the server.

The Neo4j  graph database from Neo Technologies was used as a key component of the ModelMate platform. A special ModelMate tool was created for automatically uploading any SQL Server database into a graph database (including all tables, columns, primary keys, primary key constraints, composite keys, foreign keys, foreign key relationships, implied entity relationships, NULL value processing, DateTime data type handling, etc.).

Have a great weekend,

Michael Herman (Toronto)

Parallelspace Corporation

mwherman@parallelspace.net

*ArchiMate is a registered trademark of The Open Group.

4 Comments

Filed under ArchiMate, Architecture Reference Models, Automated Enterprise Architecture Modeling, Crossing the EA Charm, Data Science, Enterprise Architecture, ModelMate

ModelMate Architecture Reference Model

[Updated October 28, 2016]

This article describes the architecture reference model for deploying a comprehensive, integrated enterprise architecture modeling and data science platform based on ModelMate.

The audience for this article is IT professionals including enterprise architects, solution architects, and security architects who want increased visibility into the deployment of their custom applications, entire data center environments, business process definitions, and LOB applications such as SAP, Oracle Financials, Salesforce, Microsoft SharePoint, and Microsoft Dynamics CRM.

A primary use case is organizations with a requirement to move one or more on-premise applications or capabilities to the cloud or need a better understanding of how their hybrid on-premise/cloud environments (e.g. Salesforce cloud applications and on-premise or third-party customer loyalty solutions).

ModelMate

Quoting from Crossing the EA Chasm: Open Repository Strategies for Enterprise Architecture, “ModelMate is a working implementation of a Microsoft SQL Server and Neo4j graph database-based repository for managing arbitrarily large collections of arbitrary entities, properties, relationships, views, etc.to enable analysis, visualization, and understanding using easily-available open source and COTS (commercial off the shelf) business intelligence (BI), data visualization, and machine learning (ML) platforms, tools and cloud services.”

The primary goal of ModelMate is to provide automated support for the Continuous Transformation Framework of the Progressive Enterprise Architecture Model (PEAM) depicted in Figure 1.

progressive-ea-model-1-0-9-peam3-ea-chasm-auto-dots

Figure 1. Progressive Enterprise Architecture Model

Continuous Transformation Framework

The Continuous Transformation Framework is a Deming Cycle based on the following 4 phases:

  1. Listening & Learning
  2. Knowledge > New Designs
  3. Plan & Act
  4. Transformative Change > New Outcomes

The Framework is depicted as a continuous cycle as shown in Figure 1 above. The Framework can also be flattened and presented as a (repeating) sequence of 4 processes (Figure 2).

peam-continuous-transformation

Figure 2. Continuous Transformation Framework

Why all of this discussion about PEAM and the Continuous Transformation Framework? It is because to be able to understand and value the ModelMate Architecture Reference Model, it’s important to understand the class of problems it is trying to solve. Automated support for Continuous Transformation is the pain; ModelMate is the pain killer.

ModelMate Architecture Reference Model

There are 3 high-level layers in the ModelMate Architecture Reference Model:

  • Apps that use the ModelMate repository
  • Continuous Transformation Framework
  • ModelMate Open Hybrid Repository (MOHR)

These 3 layers (and 4 categories of apps) are illustrated in Figure 3.  Each app category corresponds to one phase in the Continuous Transformation Framework.

marm-modelmate-open-hybrid-repository-app-categories

Figure 3. ModelMate Architecture Reference Model: 3 Layers

The choice of apps that your organization selects for each category depends on the medium-term and long-term drivers and goals for your enterprise architecture program. The app groups map to specific phases of the Framework:

  1. Listen & Learn phase
    • Ingestion
  2. Knowledge > New Designs phase
    • Pure Modeling and Layout apps
    • Modeling, Layout & Visualization apps
    • Data Science apps
    • Custom Mobile and Web apps
  3. Plan & Act phase
    • Program & Project Management apps
  4. Transformative Change > New Outcomes phase
    • Operations and Change Management apps

Figure 4 lists a sample or representative list of applications that can fulfill the needs of each app category (each phase of the Continuous Transformation Framework).

marm-modelmate-open-hybrid-repository-apps

Figure 4. ModelMate Architecture Reference Model: Apps

Ingestion

Ingestion apps are responsible for scanning the enterprise’s operational environment: systems, assets, and processes. Information captured about each entity includes its structure, metadata, performance and usage data.  Operational business data is usually not needed and not captured.

Sources of data include business process logs, configuration management databases, LOB application configurations (SAP, SharePoint, Salesforce, Microsoft Dynamics CRM, Oracle Financials, etc.), operations management systems (Azure OMS, Microsoft System Center, etc.), Microsoft MAP Toolkit, performance monitoring logs, usage and audit logs, etc.

These are inbound data sources used to automatically update and maintain the EA models stored in ModelMate. Ingestion apps are the primary data sources for the Listen & Learn phase of the Continuous Transformation Framework.

Pure Modeling and Layout Apps

There are several types of apps that comprise the Knowledge > New Designs phase of the Framework.  Pure Modeling and Layout Apps are applications that support the manual modeling of entities, relationships, and metadata as well as the manual layout of stakeholder specific views.

The apps in the group do not support any built-in analysis and visualization capabilities beyond manually-created basic views. In addition, pure modeling and layout apps do not include an end-user scripting capability for performing automated, user-defined custom analysis or visualization.

Archi is an example of a pure modeling and layout app.

Modeling, Layout & Visualization Apps

These types of apps support manual modeling of entities, relationships and metadata and the manual layout of stakeholder specific views but also include basic, advanced, and/or custom analysis and visualization capabilities.

BiZZdesign Enterprise Studio and other advanced EA modelers are examples of apps that belong to the Modeling, Layout & Visual Apps group – supporting the needs of the Knowledge > New Designs phase of the Framework.

Data Science Apps

Data Science Apps include non-traditional “enterprise architecture” modeling and analysis apps. This group includes both open sources as well as COTS (commercial off the shelf) data science tools and platforms. Data Science apps provide advanced analysis, machine learning and visualization capabilities enabled through open access to enterprise architecture data via standard protocols and APIs (e.g.ArchiMate Exchange File Format, OData, SQL Server stored procedures, entity models, and advanced query and analysis languages such as R, Cypher, and T-SQL).

Examples of Data Science apps include: R Studio, Microsoft Power BI, Tableau, Domo, Linkurious, Microsoft Excel and the Neo4j graph browser.

Custom Mobile and Web Apps

This is the last group of apps that support the Knowledge > New Designs phase of the Framework and includes both no-code and code platforms for creating custom reporting, analysis, visualization apps.

No-code custom apps designed with Microsoft PowerApps (and Microsoft PowerFlow) are examples of the former; traditional C#/VB.Net, Java, and Node.js/JavaScript apps are examples of the latter.

Program & Project Management Apps

Program & Project Management Apps support the Plan & Act phase of the Framework.

Traditional portfolio, program, and project managements apps are examples of applications in this group. Collaboration tools such as Microsoft SharePoint, Confluence, and Jira can also belong in this group. Collaboration tools can also be considered as “horizontal” solutions that can be used across all phases of the Framework.

Operations and Change Management Apps

All of the effort to create and manage a functioning enterprise architecture solution only realizes direct business value when it leads to Transformative Changes being made in the enterprise’s strategies, systems, assets, and processes; and measurable, positive New Outcomes result from the changes.

Examples of apps in this category include change management applications that support IT Service Management (ITSM) disciplines such as ITIL. ServiceNow is an example of an ITSM app.

Please provide your feedback in the Comments section below or feel free to email me directly.

Best regards,
Michael Herman (Toronto)
Parallelspace Corporation
mwherman@parallelspace.net

*ArchiMate is a registered trademark of The Open Group.

All other trademarks, servicemarks, registered trademarks, and registered servicemarks are the property of their respective owners.

4 Comments

Filed under ArchiMate, Automated Application Architecture Analysis, Automated Enterprise Architecture Modeling, Business Value, continuous transformation, Crossing the EA Charm, Data Science, ModelMate, Power BI, Progressive Enterprise Architecture Map (PEAM), Salesforce, SharePoint

Crossing the EA Chasm: Automating Enterprise Architecture Modeling #1

If you have been following my Crossing the EA Chasm blog series (and related articles), you’ll have noticed a number of common themes:

Automating Enterprise Architecture Modeling

Automated enterprise architecture modeling (and automated application architecture analysis) are activities that belong to the Listening and Learning phase of the Continuous Transformation Framework.

Progressive EA Model 1-0-9-PEAM3-EA Chasm-Auto-Dots.png

Figure 1. Progressive Enterprise Architecture Model: Continuous Transformation Framework

Supporting the above themes, the Technology layer diagram below is automatically generated from a simple, single line query applied to an automatically created and dynamically maintained model of 500+ Windows and Linux servers (blue dots) with 550+ server network adapter configurations (yellow dots) connected to 25 network gateways (blue dots representing 25 network routers/switches). The data originates from a series of tables maintained by a configuration management database (CMDB) solution. There is no way to understand what the Technology environment looks like by simply looking at these tables.  However, in the visualization below, it is easy to see that there are at least 14 different server farms, application clusters, and data centers.

Parallelspace TEAM-DevicesA.png

Figure 2. Automatically Generated Technology Layer Model and View

In this ModelMate model, servers are represented by Nodes with 179 properties;  network adapter configurations as Devices with 69 properties each; and, network gateways as Devices with 4 properties per device.

This is just the beginning as additional information about web application, database, DNS, and directory and domain management services is used to add additional  detail to the current state Technology layer of this enterprise architecture. “More news at 11…” (click here).

This effort was made easier through the use of ModelMate and the Neo4j Community Edition free, open source graph database and the Cypher query language.

Best regards,

Michael Herman (Toronto)

Parallelspace Corporation

mwherman@parallelspace.net

4 Comments

Filed under ArchiMate, Architecture Reference Models, Automated Application Architecture Analysis, Automated Enterprise Architecture Modeling, Crossing the EA Charm, Data Science, Enterprise Architecture, ModelMate, Progressive Enterprise Architecture Map (PEAM), The Open Group

#Graphitization of .NET Applications: Marrying Open EA Data with Graph Databases

[Updated October 20, 2016]

As I’ve worked to support open access to enterprise architecture data by creating the ModelMate project, the range and diversity of how enterprise data can be analyzed and visualized has proved to be amazing.  Here’s yet another example: the marrying of open EA data in ModelMate models with a graph database platform …in less than 1 day.

The native (schema-less) representation for a graph database mirrors the ArchiMate* metamodel one-for-one:

  • Entities that support named types (“labels”)
  • Relationships between directed pairs of entities that also support named types (“relationship types”)
  • Unlimited property sets per entity
  • Unlimited property sets per relationship

Add to this, powerful query capabilities, a small footprint, and hyper-scalability. For example, being able to find all of the ArchiMate concepts that are 1, 2, 3, or an infinite number of relationships away from each of the Application Components in a large model and have these queries run and visualize in milliseconds (see the examples below).

For ModelMate’s first graph database integration, Neo4j from Neo Technologies was used. It was simple and efficient to install and was useable within a few minutes.  After working most of the morning to learn the Cypher query language to integrate and query the ModelMate data, the afternoon was spent exploring the graph model and experimenting with a range of queries. The most recent ModelMate logical architecture looks like the following (October 19, 2016).

modelmategraphdbhighlighted

Figure 1. ModelMate Logical Architecture

Automated Application Architecture Analysis

What are some of the results?  Here’s a series of views created with simple, single-line queries against the ModelMate graph. The scenario is automated application architecture analysis to support migration of on-premise applications to the cloud.

This version of the VetContext ModelMate model used for this example included:

  • 8714 elements (nodes) – files, assemblies, modules, methods, fields, method calls, and field references represented as ArchiMate application and technology layer concepts
  • 16,210 relationships – modeled as ArchiMate relationships that linked the above elements into a ModelMate graph

TIP: If you click on each image, you can check out the single line query at the top of each screenshot.

vetcontexta

Figure 2. Application Architecture: Contains and References Relations (1 hop)

vetcontextb

Figure 3. Application Architecture: Contains, Defines, and References Relations (2 hops)

vetcontextd

Figure 4. Application Architecture: Accesses, Calls, Contains, Defines, References, References and Type For Relations (3 hops)

vetcontextz

Figure 5. Application Architecture: Visualize Relations between all Application Components, Artifacts, and System Software Components (any number of hops)

vetcontexte

Figure 6. VetContext ModelMate Graph: All Application Components (any number of hops)

In Figure 7 below you can see the much smaller VetContext application in the green circle in contrast with all of the public classes and methods found in the Entity Framework assembly from Microsoft (blue circle).

VetContextEFHighlighted.png

Figure 7. VetContext Application References into the Microsoft Entity Framework

Impressive for 1-day’s worth of effort (including training).

Best regards,
Michael Herman (Toronto)
Parallelspace Corporation

Mail: mwherman@parallelspace.net

p.s. What is the VetContext ModelMate model that I’m using for these blog postings?

The VetContext ModelMate model is based on the Microsoft Entity Framework sample of the same name from the book Programming Entity Framework: Code First by Julia Lerman and Rowan Miller. The ModelMate model is comprised of data from all of the .NET assemblies, modules, type definitions (including classes, enums, etc.), method definitions, field definitions, method calls and field accesses as well as the physical files that store the assemblies in the VetContext sample application. A simplified VetContext class diagram (from Visual Studio) appears below.

vetcontextclasshierarchy

Figure 8. VetContext Class Diagram

The ModelMate Scanner for .NET Application Migration reads a folder of all of the .exe and .dll files for one or more .NET applications and builds the ModelMate model. No source code is needed. The scanner reads and parses the intermediate language (MSIL) directly.

p.p.s. The original ModelMate SQL Server schema (the original data source for the ModelMate graph) looks similar to the following. This was used before ModelMate included support for graph databases.

modelmateschema-views

Figure 9. ModelMate SQL Server (non-graph database) Schema
(obsoleted by the ModelMate migration to Neo4j graph database)

 * ArchiMate is a registered trademark of The Open Group.

3 Comments

Filed under ArchiMate, Automated Application Architecture Analysis, Crossing the EA Charm, Data Science, Enterprise Architecture, Graphitization, Progressive Enterprise Architecture Map (PEAM), The Open Group