Category Archives: Progressive Enterprise Architecture Map (PEAM)

Crossing the EA Chasm: #Graphitization of ArchiMate 3.0 – Iteration 2

COPYRIGHT © 2016-2017 by Michael Herman, Toronto, Canada. All rights reserved.

First Draft: April 5, 2017

This article documents a number of parallel efforts to improve the usability, understandability, utility, and correctness of the ArchiMate 3.0 Specification. In particular, this article extends a well-received previous article Crossing the EA Chasm: Graphitization of ArchiMate 3.0 – Iteration 1 where I posed the question:

Wouldn’t it be nice to have an authoritative reference for ArchiMate 3.0, more specifically, a repository for the enterprise architecture language‘s elements and relationship matrix, that is queryable.

This article documents the current iteration of the ModelMate project, Iteration 2, whose goal is to create an improved queryable repository for a corrected version of relationship matrix (more correct relative to the Appendix B tables in the current ArchiMate 3.0 Specification).

Background

Over the past few months, I’ve written several articles commenting on the current state of the ArchiMate language for Enterprise Architecture including:

In addition, there are almost weekly postings about usability issues or errors with the Specification in the Linkedin ArchiMate group, the GitHub Archi issues log, LinkedIn Pulse, and the Google ArchiMate group; as well as other forums [1][2].

The recent effort, called the ModelMate project, is a focused effort to create a more broadly applicable, usable, useful, ArchiMate-based, extensible language environment for enterprise architecture as described in these 4 articles:

Current Scenario

The current scenario is highlighted by the following points taken from the above references:

  • “[People should be] encouraged to try to model these examples for yourself: to start learning how to “think in ArchiMate” as your second or third written language.” The way the ArchiMate language is currently designed and, more importantly, described makes this difficult.
  • In an abstract sense, the extension of the ArchiMate language is supported but, in reality, few if any broadly adopted extensions have appeared in the market. A better approach is described here: Crossing the EA Chasm: ArchiMate 3.0, fix it or re-purpose it?
  • There is no single, authoritative, machine-readable version of the ArchiMate 3.0 relationship matrix; let alone one that is easily accessible and queryable.
  • The Open Group’s insistence on using abstract terminology to name element types and relation types presents users with additional challenges.

Problem Description

At a data level, the root causes of the problems with the ArchiMate 3.0 relationship matrix in Appendix B of the ArchiMate 3.0 Specification include:

  • No machine-readable version of the tables are available for external validation for correctness
  • The tables contain errors in the approximately 11,000 relations that are represented in the tables.  Is is estimated that there are few hundred to a few thousand errors present in the current ArchiMate 3.0 tables
  • The tables contain all possible (valid) relations but do not differentiate between Core relations and Derived (non-Core) relations.

All three issues are critical for the ArchiMate 3.0 Specification and these tables to be trusted and more generally useful.

In addition, the Derived Relation Derivation Algorithm has never been published by The Open Group.  Attempts to create an alternative algorithm have highlighted that the text of the ArchiMate 3.0 Specification is neither consistent nor complete when it comes to identifying the set of Core Relations and a correct and complete Derviation Algorithm.

Lastly, when dealing with 1000+ Core Relations and several thousand Derived Relations (8000-9000 or more), it’s difficult to analyze and visualize what the ArchiMate 3.0 relationship matrix looks like in total, or when subdivided by Domain (Layer) or Aspect, or when focused on a specific element prototype (e.g. Node).

Solution Overview

The goal of this solution is to publish a very detailed, rich, unnormalized version of the latest and greatest ArchiMate 3.0 relationship matrix in multiple formats; including:

  • CSV text file
  • Microsoft Excel workbook
  • Microsoft Access database
  • Neo4j Cypher Query Language (CQL) queryable graph database file

When loaded into Microsoft Excel, the CSV and Microsoft Excel workbook format files appear as shown in Figure 1 (below).

Step 00 ModelMate Master Dataset Complete.png

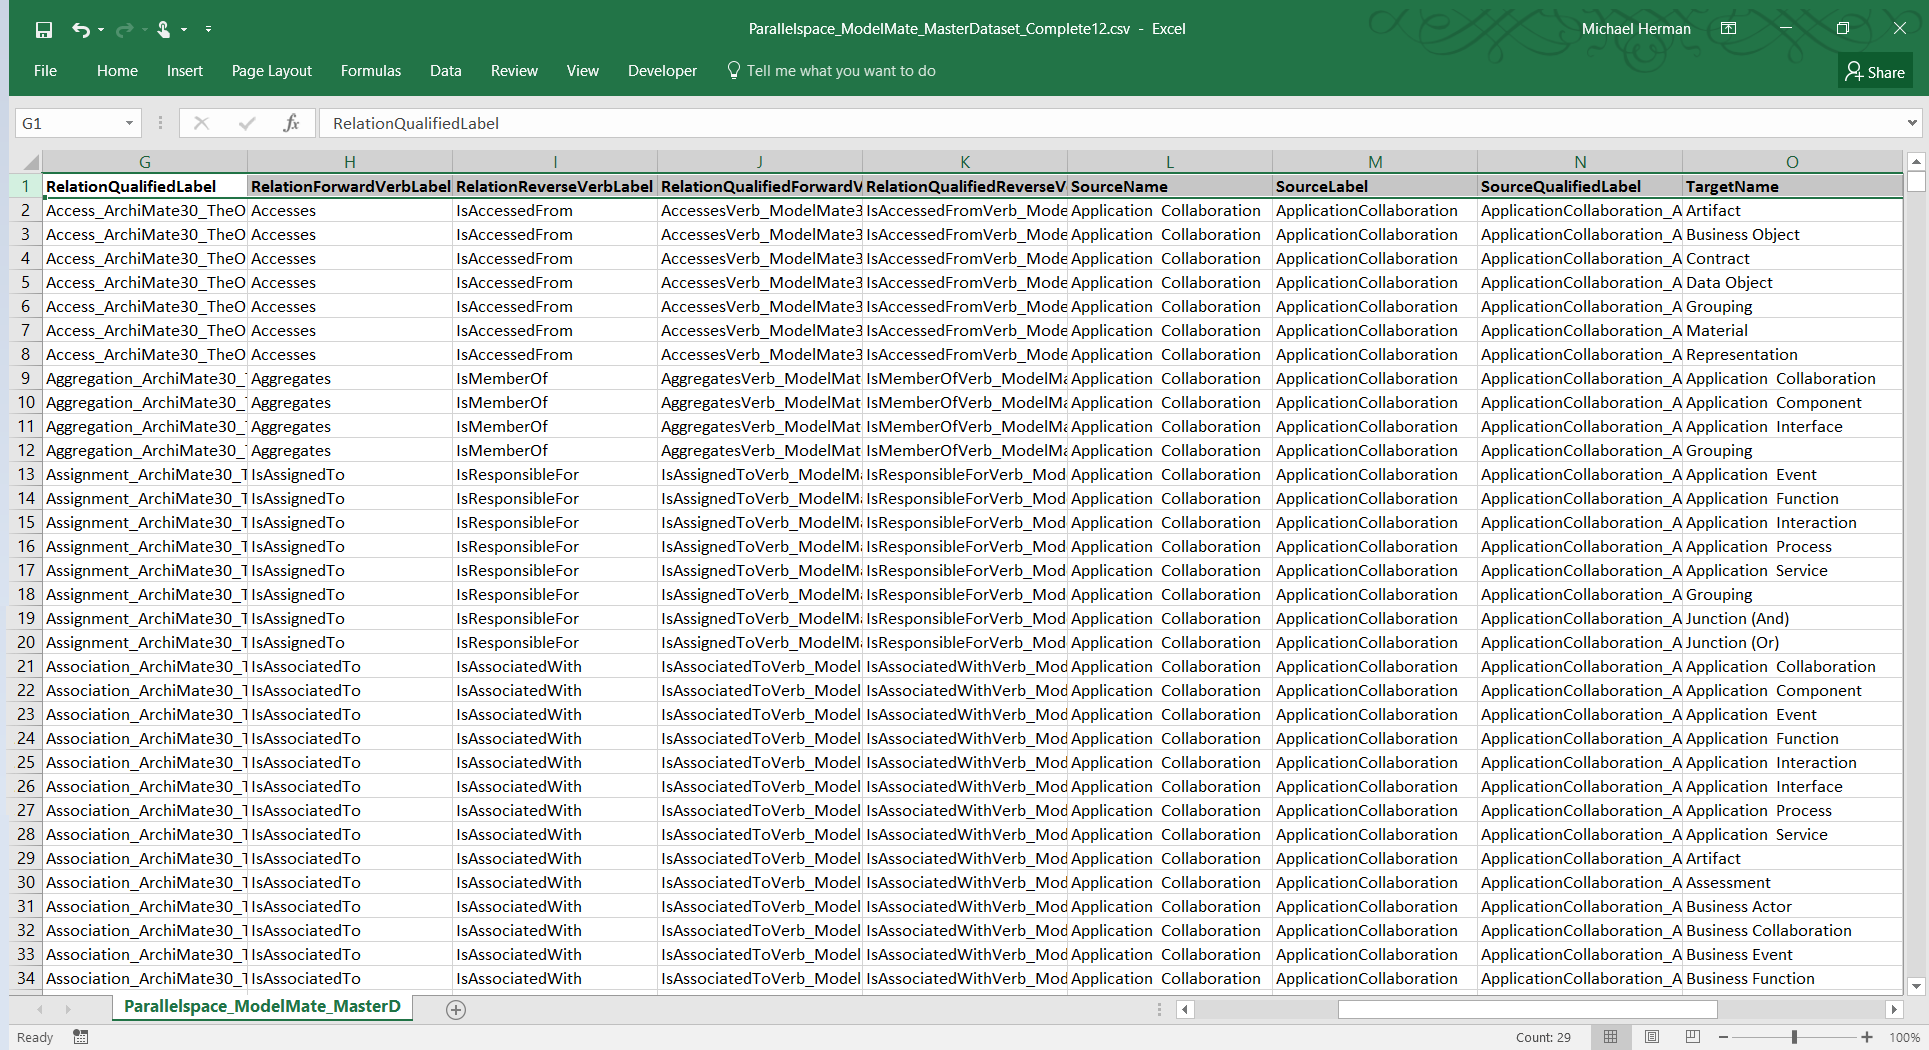
Figure 1. ModelMate Master Datasets: Excel 2016 and CSV File Formats

The Microsoft Excel (and CSV) format file can also be used with the Microsoft Excel Web App (Figure 2) and the Microsoft Excel format can be used to create custom SharePoint lists (Figure 3).

step-00-modelmate-master-dataset-complete-web-excel

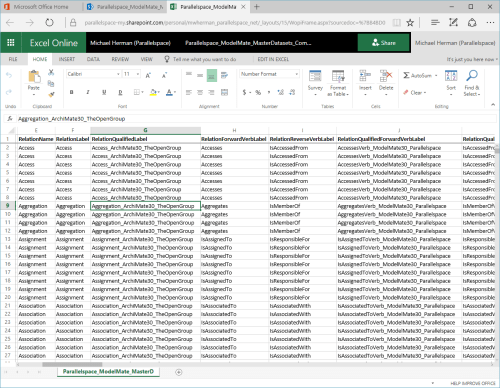
Figure 2. ModelMate Master Datasets: Excel 2016 format file in MIcrosoft Excel Web App

step-00-modelmate-master-dataset-complete-splist

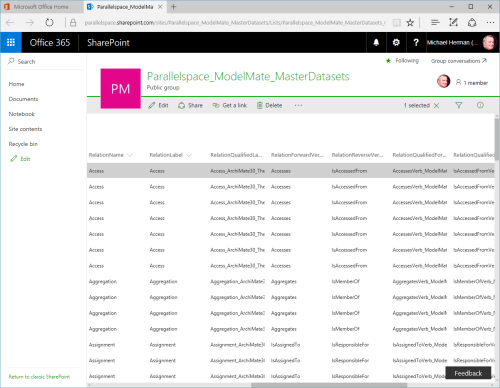
Figure 3. ModelMate Master Datasets: Custom SharePoint List created from Imported Excel 2016 Format File

When loaded into Microsoft Access, the Microsoft Access database format files appear as shown in Figure 4 (below).

step-00-modelmate-master-dataset-complete-access

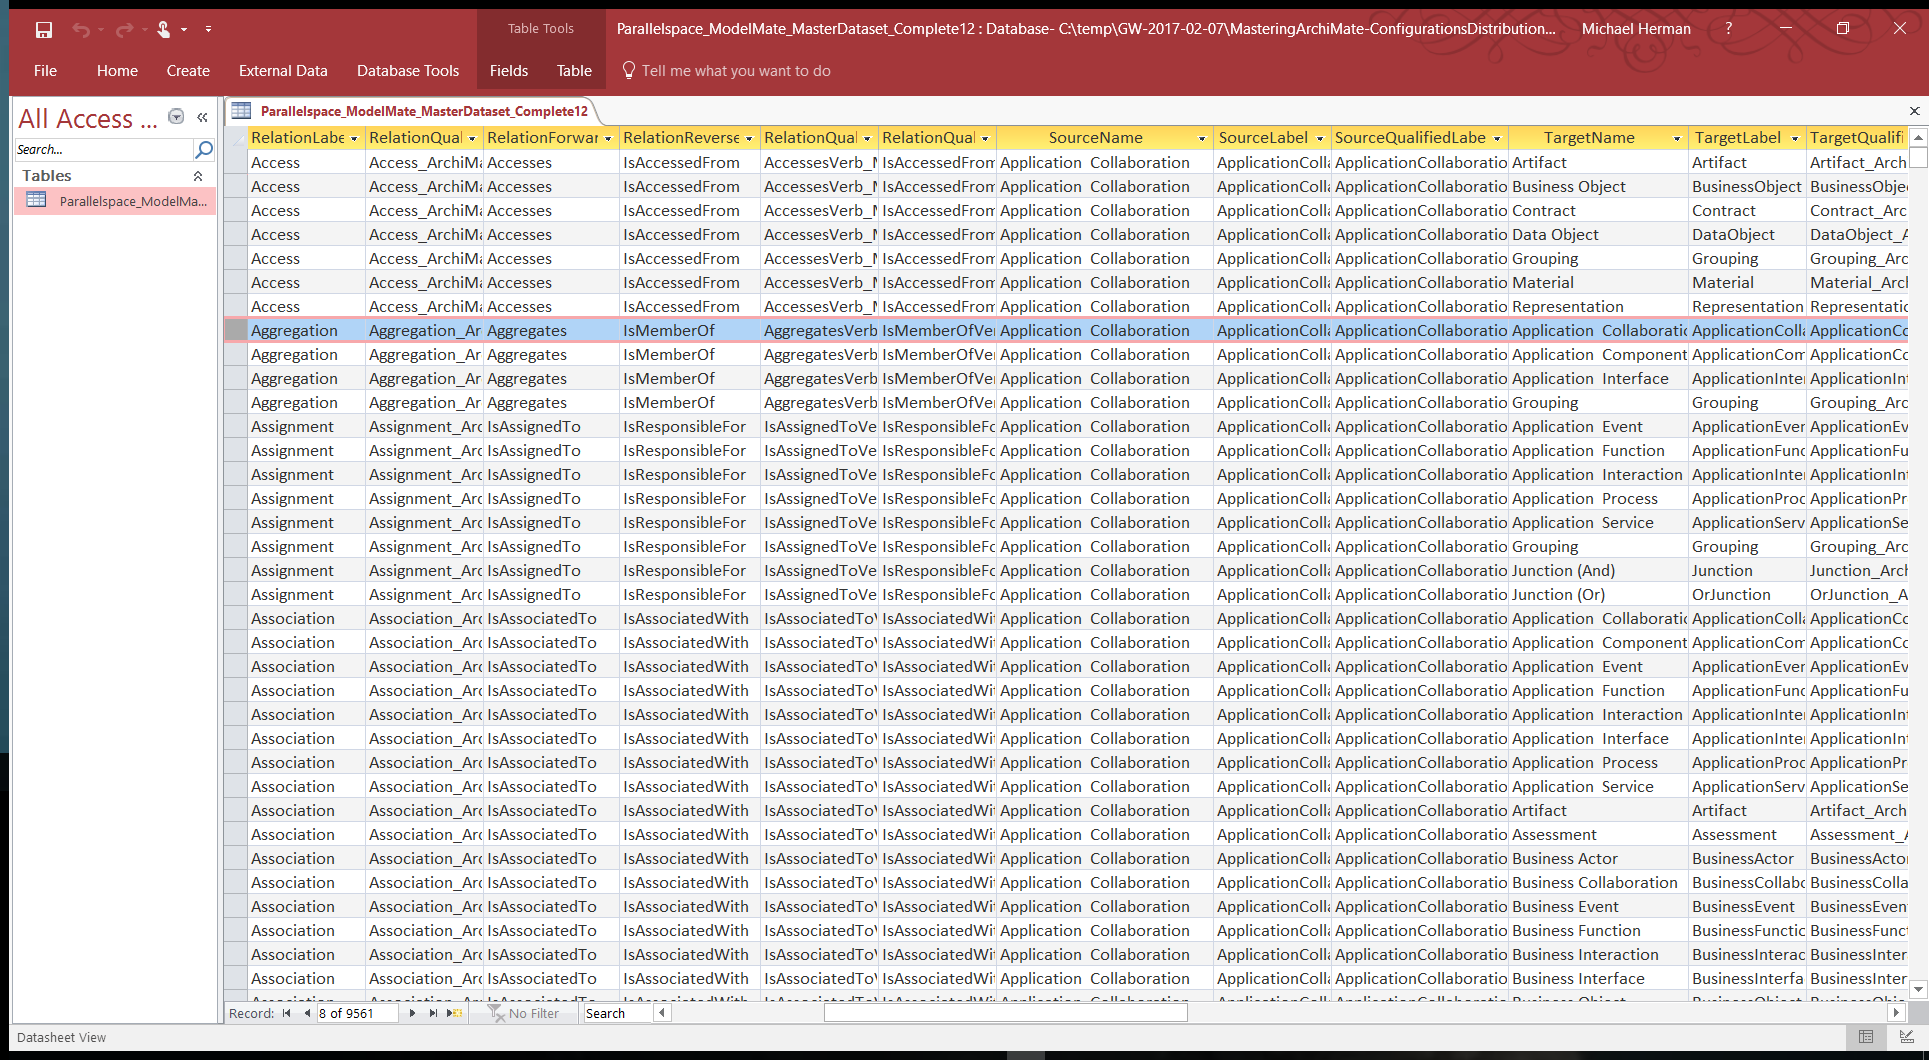
Figure 4. ModelMate Master Datasets: MS Access Database file format

To create a queryable graph database version of the ArchiMate 3.0 relationship tables (in effect, the entire ArchiMate 3.0 metamodel), the Cypher Query Language (CQL) file depicted in Figure 5. was created.

Step 00 ModelMate Master Dataset Complete-CQL.png

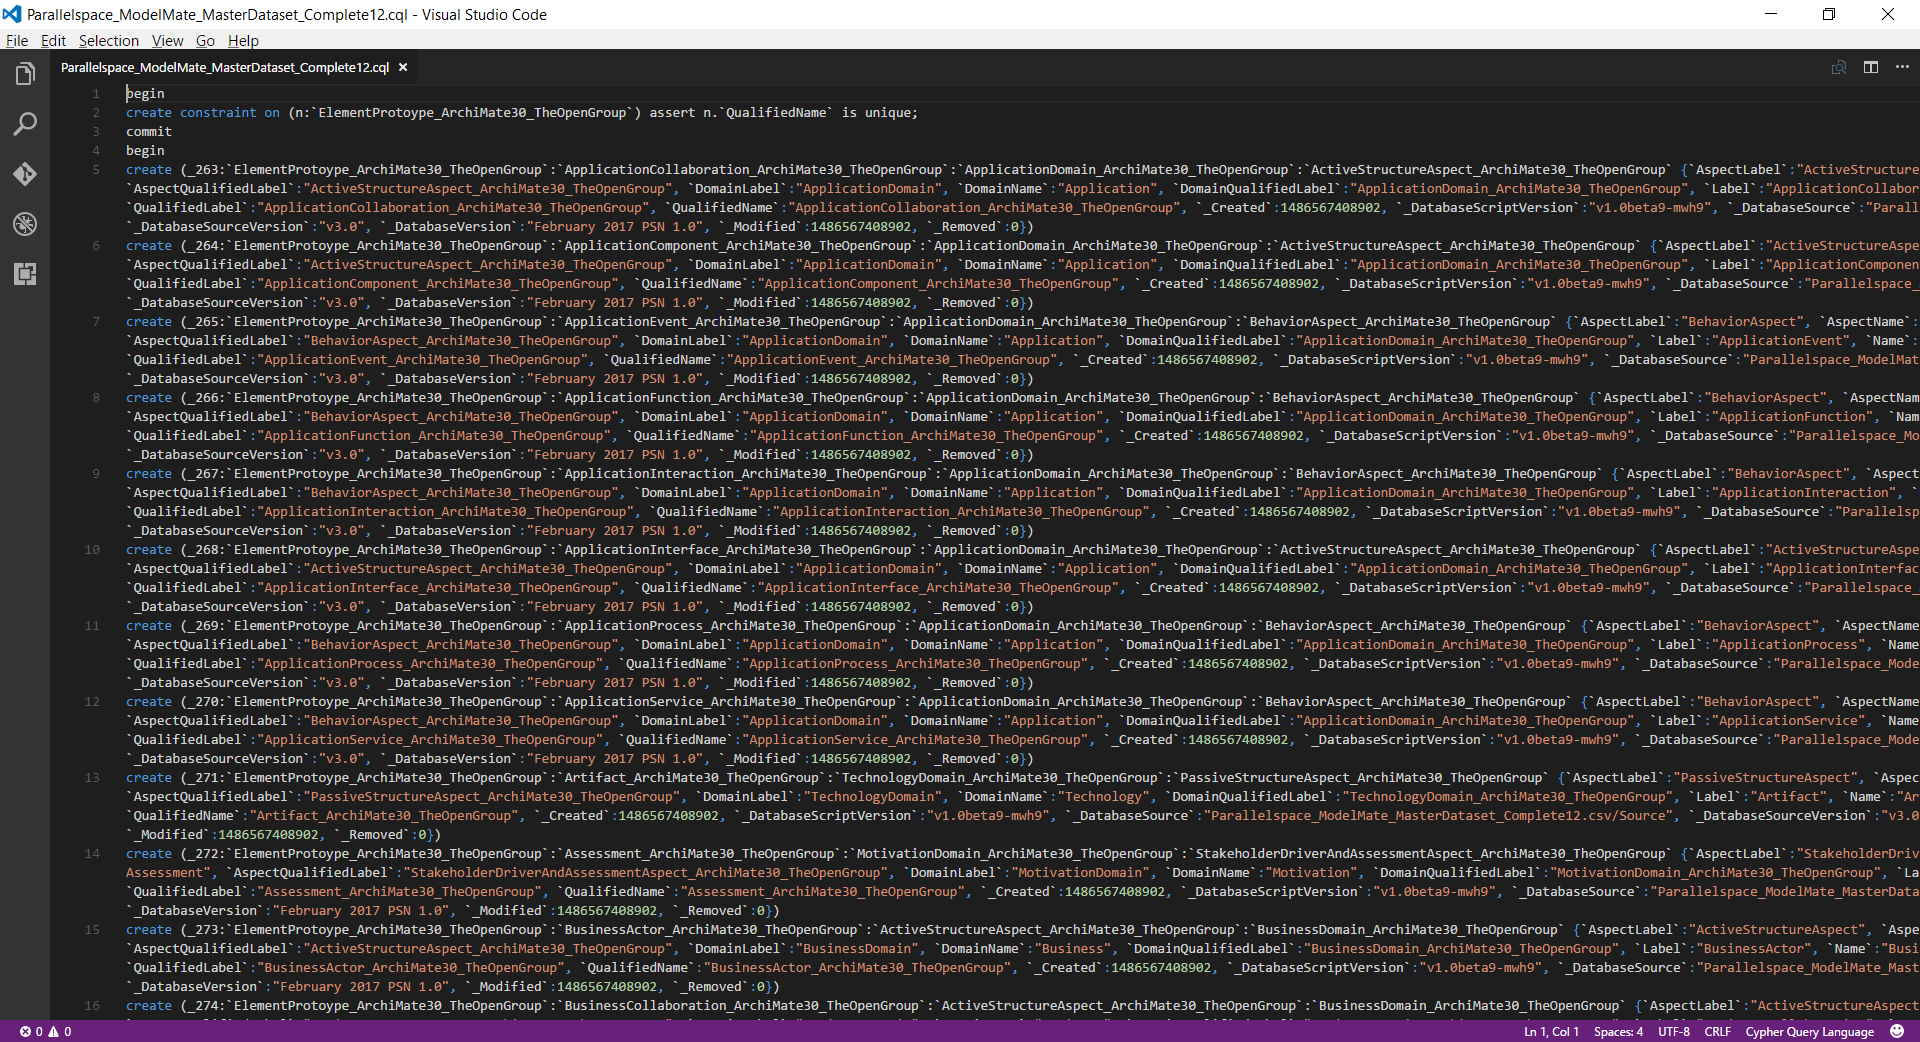
Figure 5. ModelMate Master Datasets: Neo4j CQL File

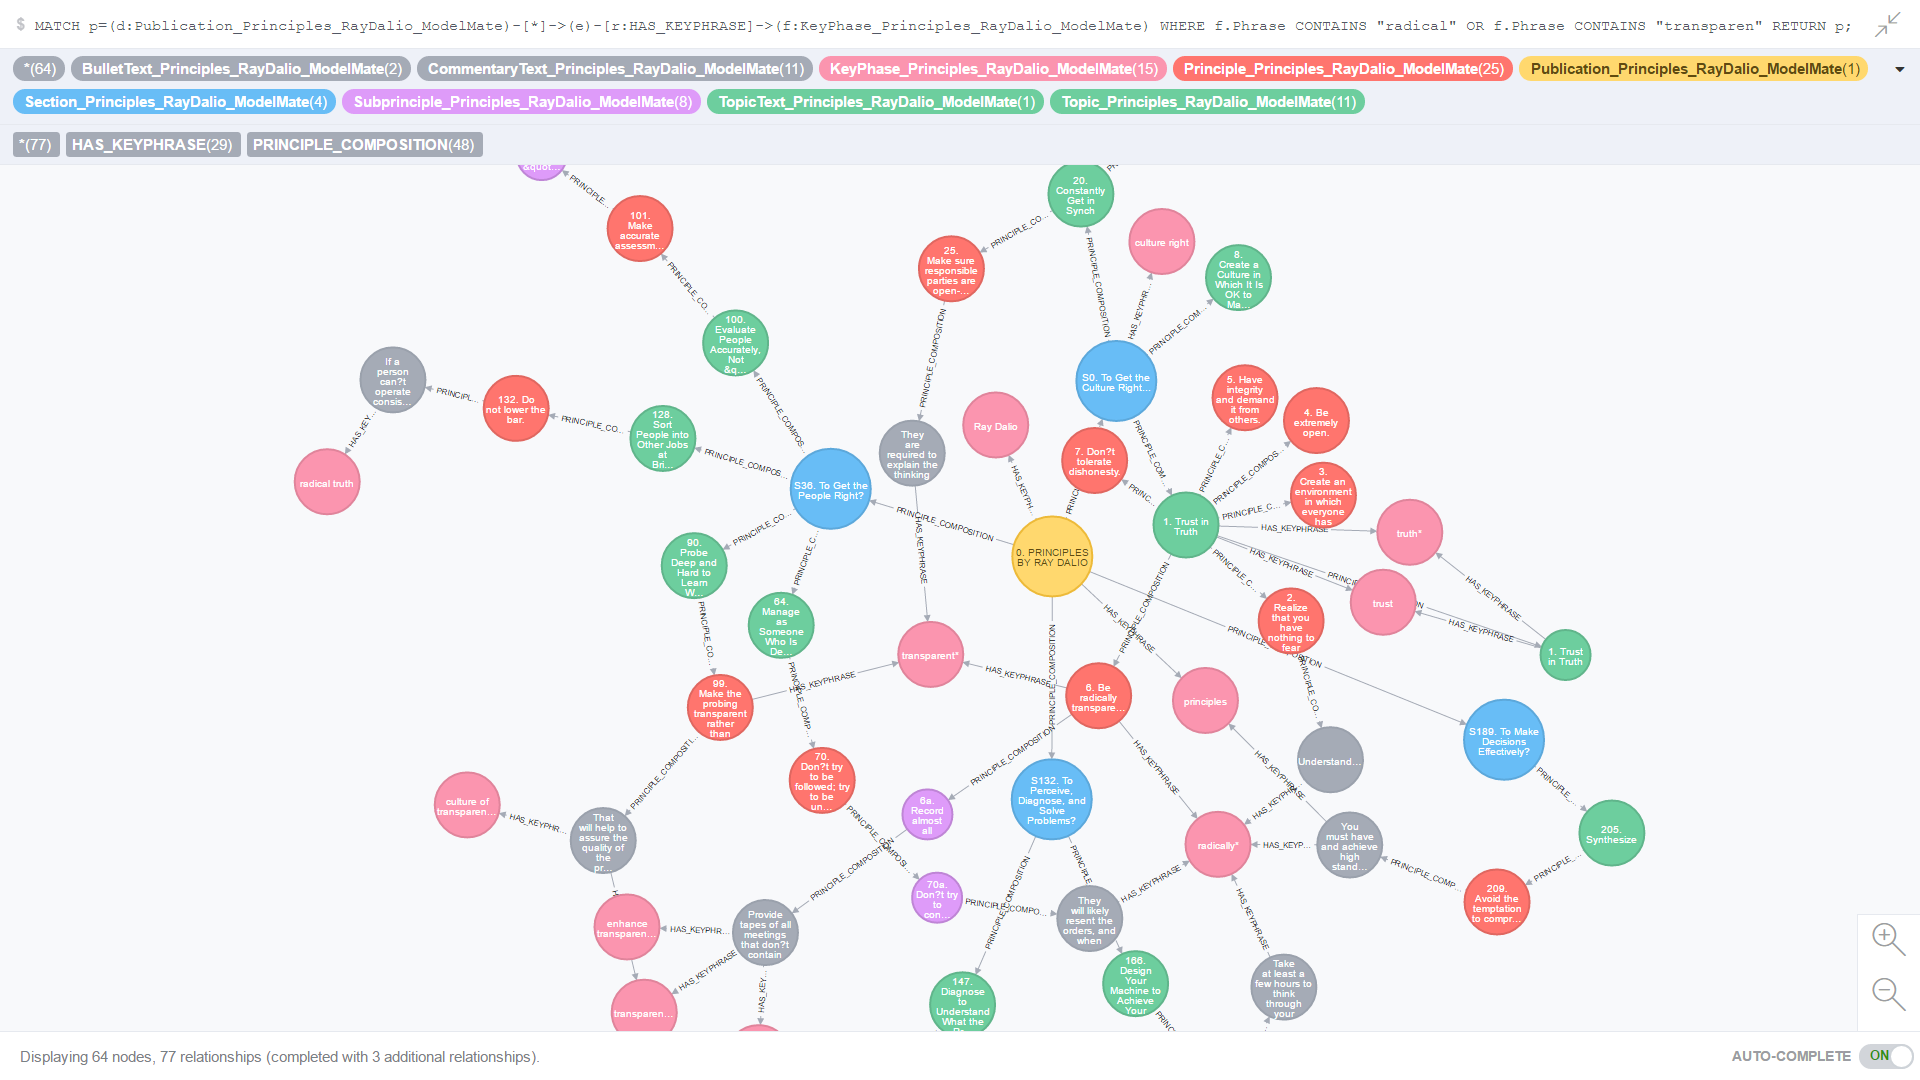
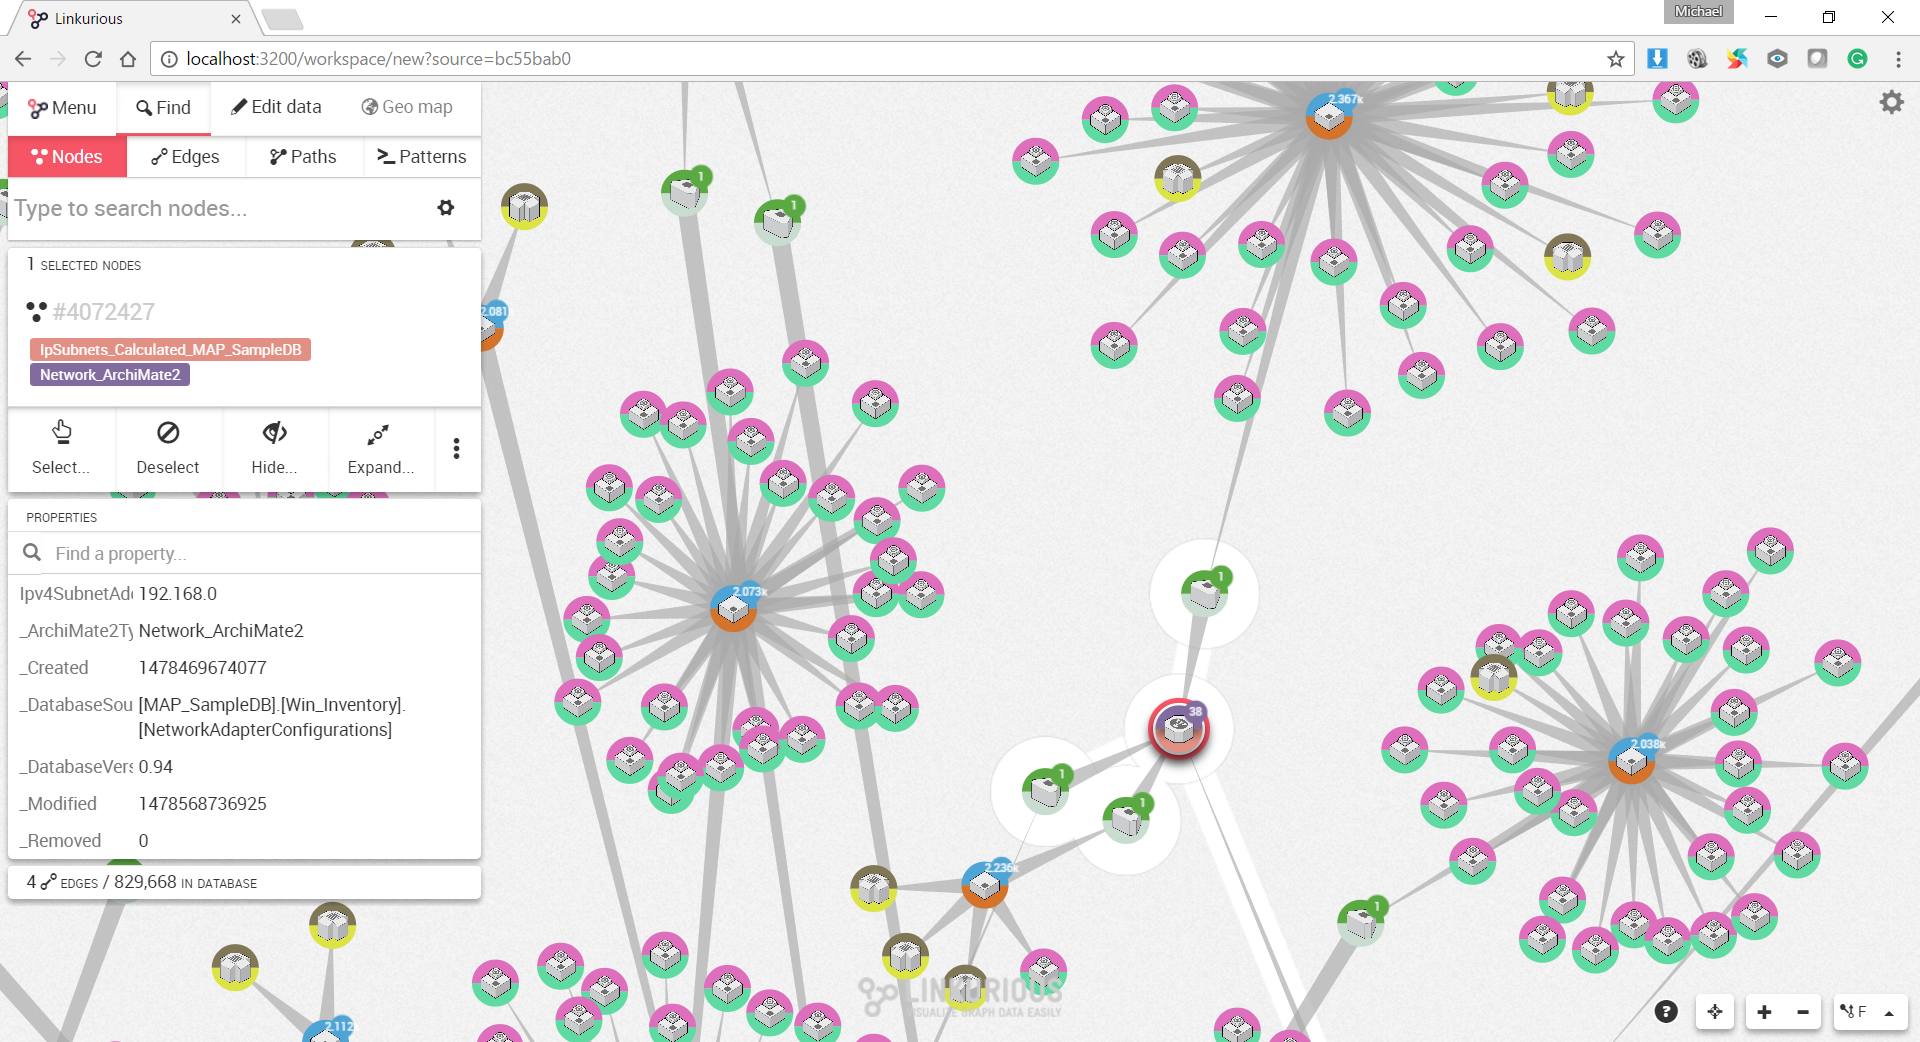
Figure 6 is an example of the output from a single line CQL query run against the ArchiMate 3.0 graph database (implemented using Neo4j).  If you look closely at the CQL statement at the top of this screen shot (click Figure 6. to enlarge it), you’ll see that it is selecting all of the relationships across all of the element prototypes in the Technology/Infrastructure domain of the ArchiMate 3.0 metamodel that connect to the Node element prototype.

370-parallelspace_modelmate_masterdataset_complete10-technologydomain7

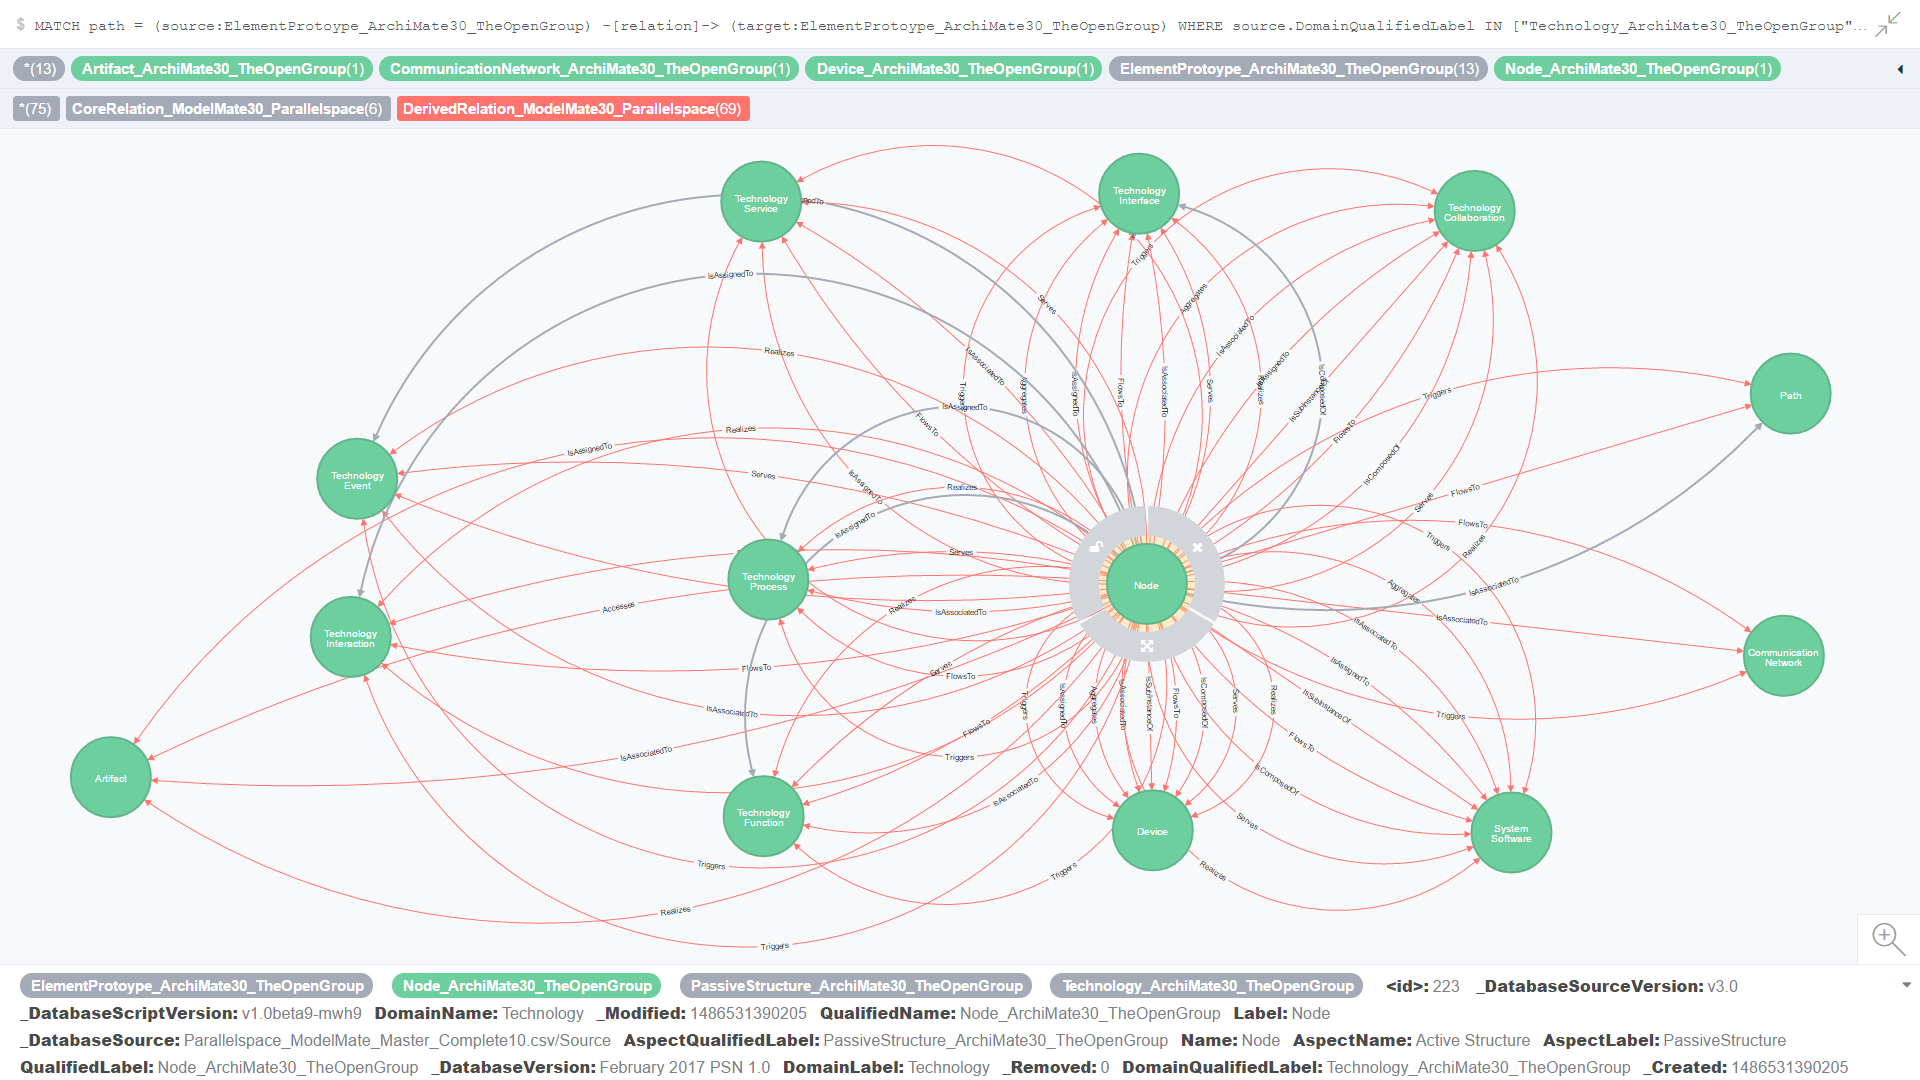
Figure 6. ModelMate Master Datasets: Graph Mining Analysis Sample

File Downloads

You can download the files referred to in this article from the GitHub repository. Click here to download the ModelMate Master Datasets files.

In addition, there is a Neo4j Cypher Query Language (CQL) file available for download that will ingest all of the element prototypes and relations into a graph database using a single Neo4j shell invocation. From the Windows Powershell or Windows Command Prompt, use:

“C:\Program Files\Java\jre1.8.0_91\bin\java.exe” -classpath “C:\Program Files\Neo4j CE 3.0.6\bin\neo4j-desktop-3.0.6.jar” org.neo4j.shell.StartClient -c dump > MasterDataSet.cql

Lastly, there is Microsoft Access 2016 database version of the CSV file that is available for download if you prefer using Microsoft Access SQL queries or graphical SQL queries.

Solution Details

Below is a copy of the workflow and dataflow used to create the Parallelspace ModelMate Master Datasets.  It’s not as messy as it looks – it’s true mashup and a valuable one at that. It’s primarily the result of the truly ad-hoc collaboration between 3 enterprise architecture professionals with an interesting mix of diverse goals (Gerben Wierda, Ed Roberts and myself); each of us with our own set of preferred development technologies and goals (with Excel being the greatest common denominator (GCD)).

community-basedderivedrelationsproject7

Figure 7. ArchiMate 3.0 Relationship Matrix Resolution Process

The numbered steps in Figure 7. are explained below:

01Data Sources. There are many sources of information about the ArchiMate relationship matrix in addition to the Appendix B tables in the ArchiMate 3.0 Specification. The list in Figure 7. is a fairly complete. Key data sources include the GitHub Archi repository for the most widely used ArchiMate modeling tool for enterprise architecture and Gerben Wierda’s multiple ArchiMate resources publishing under the Mastering ArchiMate brand.

02“MA Core Set” Spreadsheet. Wierda worked to consolidate various data sources from Step 1 above to create the “MA Core Set” Mastering ArchiMate relationship matrix (plus a number of other relationship matrices that Wierda used for comparative analysis and troubleshooting purposes). The “MA Core Set” represents the “seed” or Core Set of (non-derived) ArchiMate relations. Wierda created this Core Set over several iterations reviewing the word-for-word text of the Specification, the inheritance diagrams, as well as incorporating his extensive practical knowledge and experience documenting ArchiMate in the book entitled Mastering ArchiMate – Edition II.

The “MA Core Set” tab in the AllowedRelationsArchiMate30VBA-public.xlsm Excel spreadsheet also includes additional columns that are reserved for calculating and storing an intermediate 3-column, reverse-transposed version of the relationship matrix (Step 3 below).

03CreatePrologList() Visual Basic for Applications (VBA) Macro: This macro is used to perform the actual reverse-transposition of the “MA Core Set” relationship matrix into the 3-column format which including a column for storing the relation(source,target) 3-tuple formatted data (in Prolog format). The 2-D relationship matrix is the input to the macro (along with some additional master data tables that are part of the VBA code). The 3-tuples are the essential output of the VBA macro (stored “in-place” in the first 3 columns of the spreadsheet).

04CoreSet.prolog File. To proceed through to the next step of the workflow, the Prolog format data is copied from the spreadsheet and pasted into a plain text file called CoreSet.prolog, for example (or any other filename you would like to use).

05 Derivaton.py Python Script and outfile.csv. The Derivation.py script contains is the “magic sauce”. Written by Wierda, Derivation.py reads the CoreSet.prolog file and executes a complex and detailed algorithm to expand the Core Set of ArchiMate relations read from the CoreSet.prolog file into a number of alternative output formats, including CSV and Prolog formats.

To support the ModelMate project, a version of Derivation.py was modified to output a number of additional CSV columns (outfile.csv). Columns:

  1. SourceElement
  2. TargetElement
  3. Relation
  4. RelativeStrength
  5. IsInputRelation
  6. StandardVersion
  7. ScriptVersion

06Outfile.xml File. Steps 6 and 7 are part of a sequence of activities that were used to create a relationships.xml file that is compatible with the relationship configuration requirements of the Archi modeling tool. This process, originally implemented by Ed Roberts, owner of Dallas-based Elparazim, uses Excel to load the outfile.csv save it out as an outfile.xml file.

07For Step 7, Ed Roberts wrote an XSL Transform script that when applied to the outfile.xml file creates the Archi-compatible relationship.xml that is used by the Archi model to automatically configure the element-element relations supported in a given version of Archi (e.g. Archi 4.0).

08Steps 8-10 mark an alternative data flow created to support the needs of the ModelMate Master Datasets project.

In Step 8, the contents of the ModelMate-compatible modified CSV output from Step 5 (outfile.csv) is copy-and-pasted into the Parallelspace_ModelMate_MasterDatasets_CoreAndDerivedNN.xlsx Excel workbook (where NN is a version number).

A matrix of automated Excel functions in the Complete spreadsheet merge the elements and relations master data attributes from the Elements and Relations spreadsheet with the data from the Derived spreadsheet to compute the corresponding column values in the Complete spreadsheet. Think of the Complete spreadsheet as a super-unnormalized version of the relationship matrix.  The InInputRelation column values indicate whether a specific relation (and it’s companion source and target elements) are Core relations or Derived relations.

The workbook contains 4 spreadsheets (Derived, Complete, Elements, and Relations):

  • Derived spreadsheet – copy-and-pasted version of the outfile.csv from Step 4. The “input” spreadsheet.
    Columns:

    1. SourceElement
    2. TargetElement
    3. Relation
    4. RelativeStrength
    5. IsInputRelation
    6. StandardVersion
    7. ScriptVersion
  • Complete spreadsheet – leverages the master data in the Elements and Relations tabs to expand the columns in the Derived spreadsheet to include additional metadata property columns for the source and target elements as well as the relations. The “output” spreadsheet that will be saved as a CSV file in Step. 9.
    Columns:

    1. SourceElement
    2. TargetElement
    3. Relation
    4. RelativeStrength
    5. IsInputRelation
    6. StandardVersion
    7. ScriptVersion
    8. RelationName
    9. RelationLabel
    10. RelationQualifiedLabel
    11. RelationForwardVerbLabel
    12. RelationReverseVerbLabel
    13. RelationQualifiedForwardVerbLabel
    14. RelationQualifiedReverseVerbLabel
    15. SourceName
    16. SourceLabel
    17. SourceQualifiedLabel
    18. TargetName
    19. TargetLabel
    20. TargetQualifiedLabel
    21. SourceDomainName
    22. SourceDomainLabel
    23. SourceDomainQualifiedLabel
    24. SourceAspectName
    25. SourceAspectLabel
    26. SourceAspectQualifiedLabel
    27. TargetDomainName
    28. TargetDomainLabel
    29. TargetDomainQualifiedLabel
    30. TargetAspectName
    31. TargetAspectLabel
    32. TargetAspectQualifiedLabel
  • Elements spreadsheet – master data attributes and values for each element prototype.
    Columns:

    1. ElementCode
    2. ElementLabel
    3. ElementName
    4. ElementQualifiedLabel
    5. DomainName
    6. DomainLabel
    7. DomainQualifiedLabel
    8. AspectName
    9. AspectLabel AspectQualifiedLabel
  • Relations spreadsheet – master data attributes and values for each relation prototype.
    Columns:

    1. RelationCode
    2. RelationName
    3. RelationQualifiedLabel
    4. RelationForwardVerb
    5. RelationQualifiedForwardVerb
    6. RelationReverseVerb
    7. RelationQualifiedReverseLabel

09In Step 9, columns 4-32 of the Complete spreadsheet are saved as a separate CSV format file (using the same versioned file name as the parent workbook but with a suffix of .csv).

Also considered part of Step 9, the CSV file is imported into an empty Microsoft Access database. The datatype of the InInputRelation is changed to be a Yes/No (boolean) field. The database file is given the same name as the CSV file but with a suffix of .accdb.

10Step 10 uses a series of Cypher Query Language (CQL) script files to create and populate a Neo4j graph database – to enable simple but powerful ad-hoc queries against the ArchiMate 3.0 relationship tables/metamodel.

Step 10.1. Merge all of Source and Target Element Prototypes

step-01-merge-element-prototypes

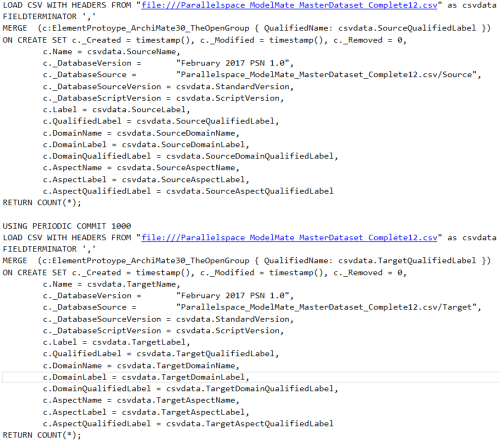
Script 1. Merge Source and Target Element Prototypes

Step 10.2. Label Elements with Element, Domain and Aspect Names

step-02-label-elements-with-element-domain-and-aspect-names

Script 2. Label Elements with Element, Domain and Aspect Names

Step 10.3 Create the Metamodel Relationships

TODO

Results

Use Cases

This section documents the results of the following use cases (queries against the Neo4j graph model):

  1. All Business domain source and target element prototypes and all related Core and Derived relationships
  2. All Core relationships where the source element prototype is from the Business domain
  3. All Core relationships where the source and target element prototypes are from the Business domain
  4. All Application domain source and target element prototypes and all related Core and Derived relationships
  5. All Core relationships where the source and target element prototypes are from the Application domain
  6. All Core and Derived relationships where the source and target element prototypes are from the Technology/Infrastructure domain
  7. All Core relationships where the source and target element prototypes are from the Technology domain
  8. All Core relationships where the source and target element prototypes are from the Technology domain and are identical to each other
  9. All Core relationships where the source and target element prototypes are from the Technology domain and are different from each other (non-self referencing)
  10. All Core and Derived relationships where the source and target element prototypes are from the Technology domain and are different from each other (non-self referencing)
  11. All Core and Derived relationships where the source and target element prototypes are from the Technology domain and connected to the Node element prototype
  12. All Core relationships where the source and target element prototypes belong to the Passive Structure aspect
  13. All Core relationships where the source and target element prototypes belong to the Active Structure aspect
  14. All Core relationships where the source and target element prototypes belong to the Behavior aspect

Use Case Results

Click on any of the figures to enlarge them in a separate browser tab.

Business Domain Use Case Results

Use Case 1: All Business domain source and target element prototypes and all related Core and Derived relationshipsUse Cases

Figure 8. is the result of an ad-hoc CQL query against all element prototypes in the Business domain; more specifically, where both the source and target element prototypes are in the Business domain.

100-parallelspace_modelmate_masterdataset_complete10-businessdomain

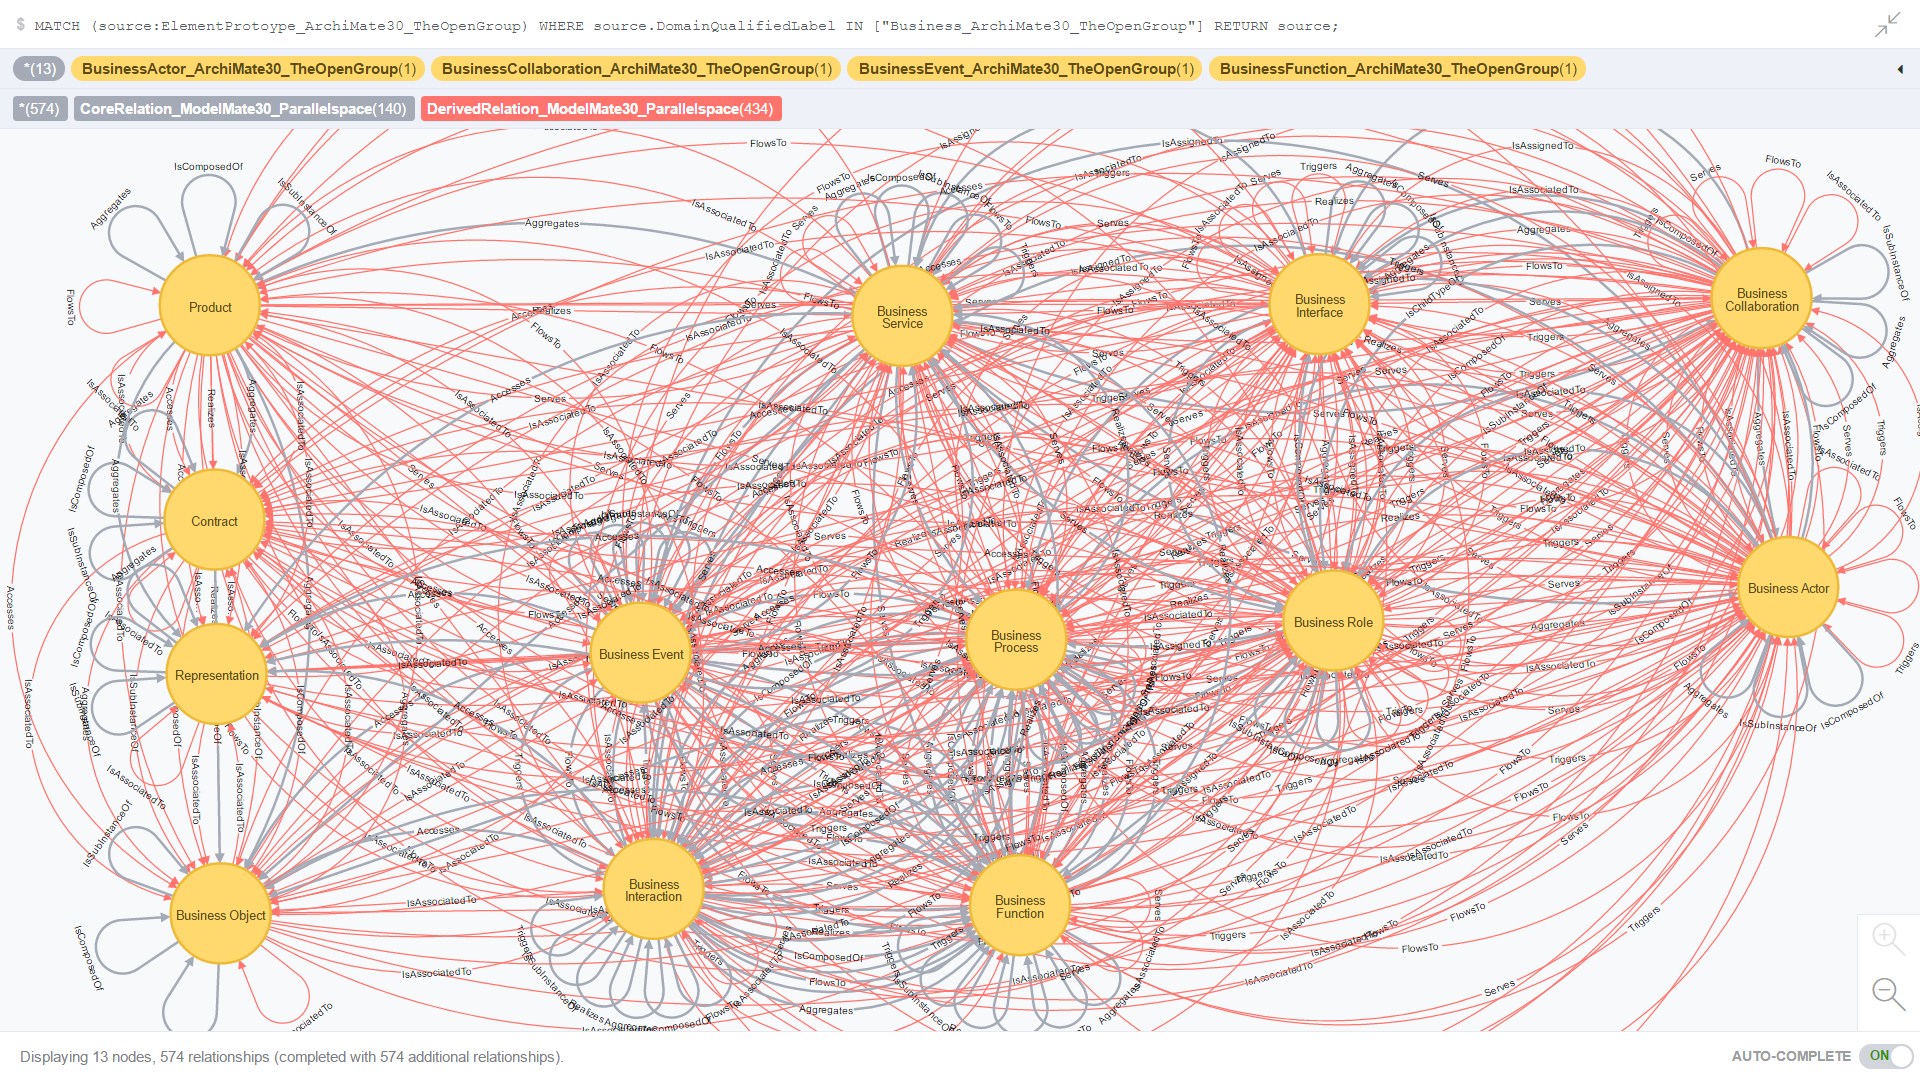
Figure 8. All Business domain source and target element prototypes and all related Core and Derived relationships

Use Case 2: All Core relationships where the source element prototype is from the Business domain

Figure 9. is the result of an ad-hoc CQL query against all Core relationships where the source element prototype is from the Business domain.

120-parallelspace_modelmate_masterdataset_complete10-businessdomain2

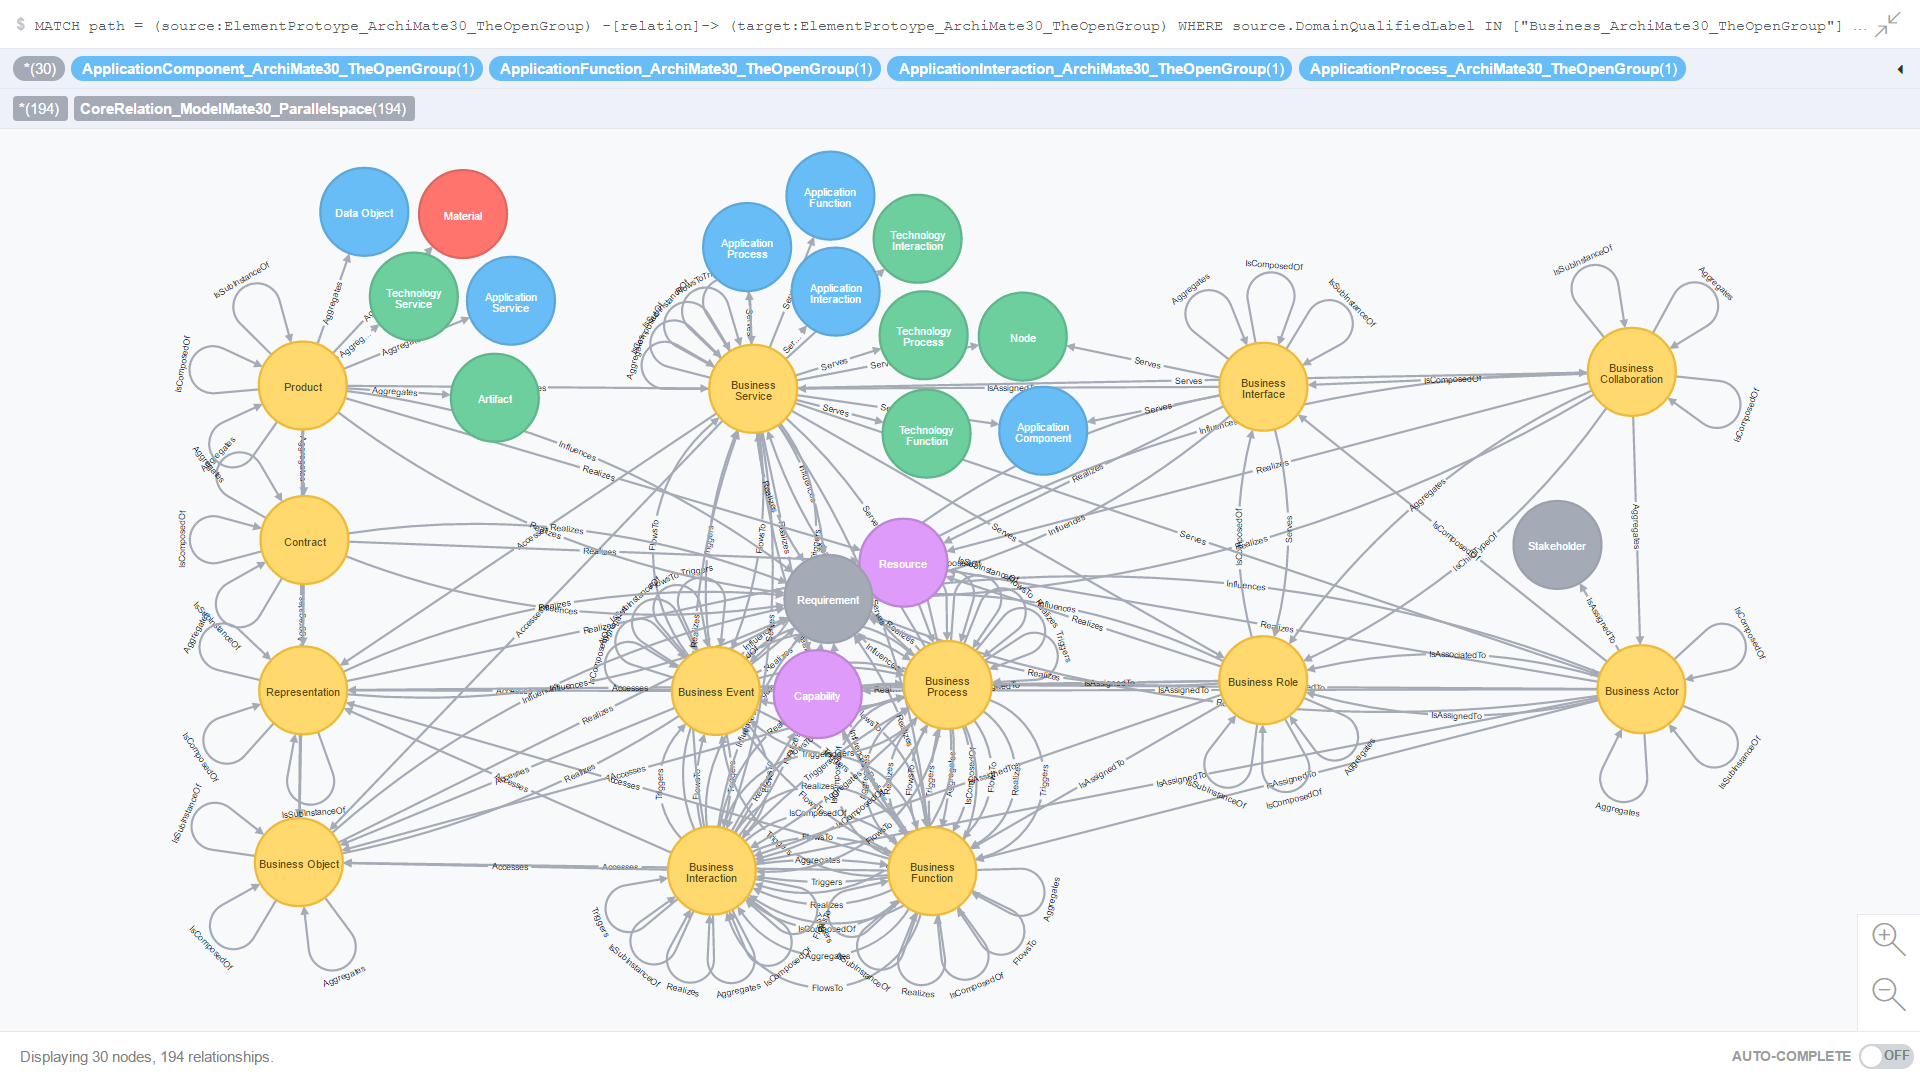
Figure 9. All Core relationships where the source element prototype is from the Business domain

Use Case 3: All Core relationships where the source and target element prototypes are from the Business domain

Figure 10. is the result of an ad-hoc CQL query against all Core relationships where both the source and target element prototypes are from the Business domain.

130-parallelspace_modelmate_masterdataset_complete10-businessdomain3

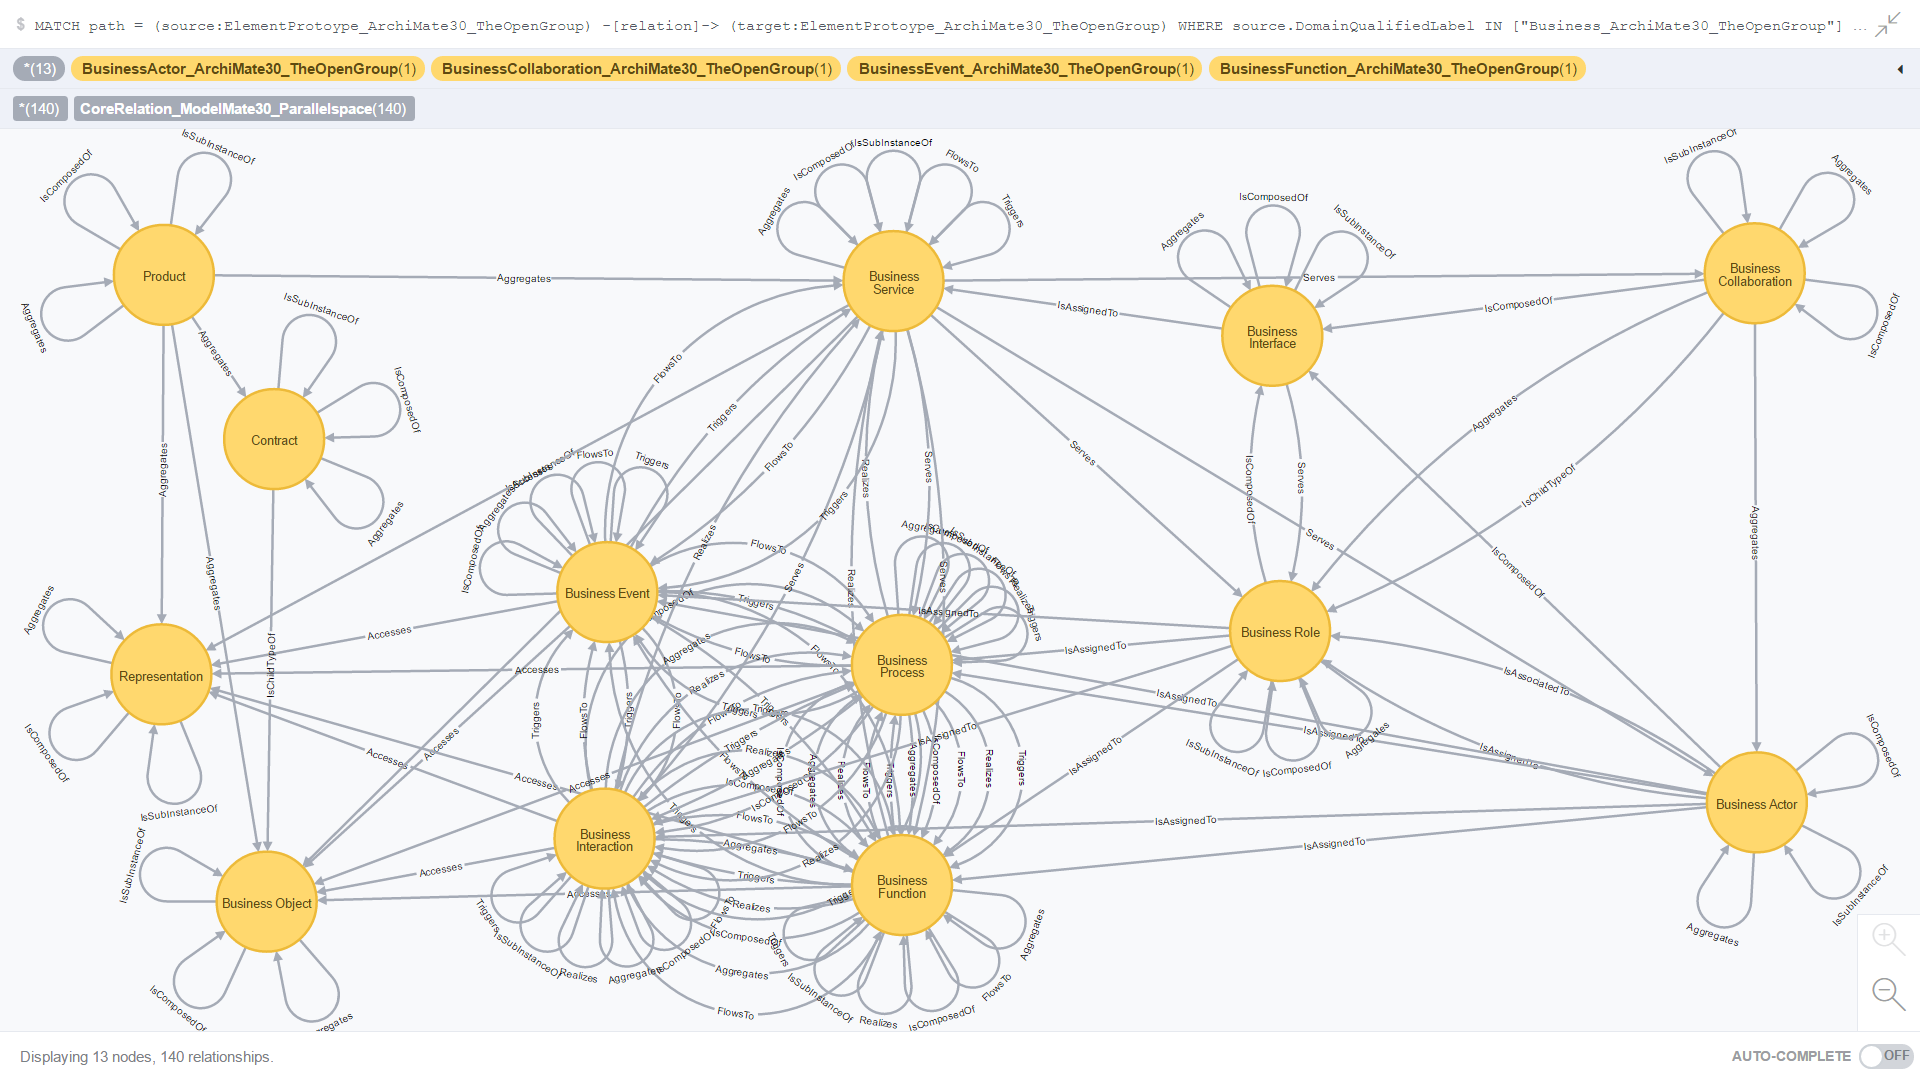
Figure 10. All Core relationships where the source element prototype is from the Business domain

Application Domain Use Case Results

Use Case 4: All Application domain source and target element prototypes and all related Core and Derived relationships

Figure 11. is the result of an ad-hoc CQL query against all element prototypes in the Application domain; more specifically, where both the source and target element prototypes are in the Application domain.

200-parallelspace_modelmate_masterdataset_complete10-applicationdomain

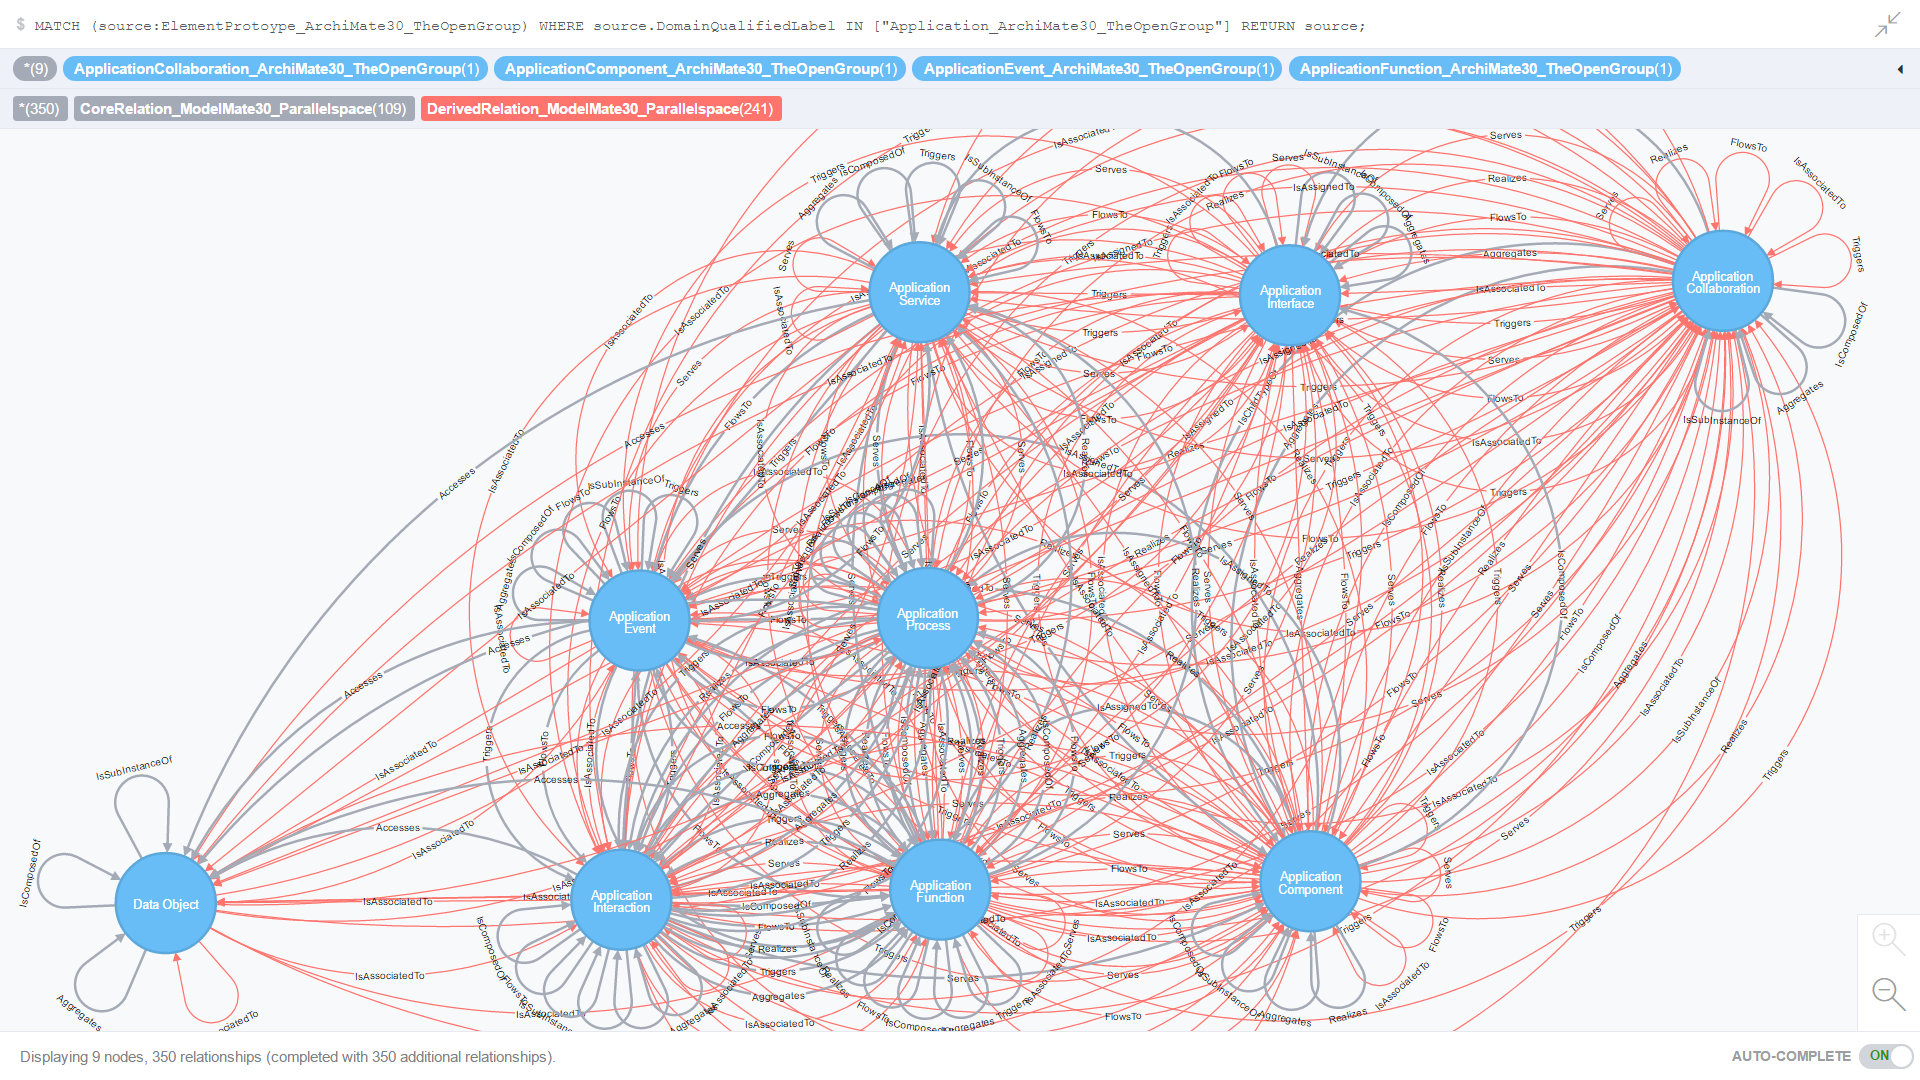
Figure 11. All Application domain source and target element prototypes and all related Core and Derived relationships

Use Case 5: All Core relationships where the source and target element prototypes are from the Application domain

Figure 12. is the result of an ad-hoc CQL query against all Core and Derived relationships where the source element prototype is from the Application domain.

230-parallelspace_modelmate_masterdataset_complete10-applicationdomain3

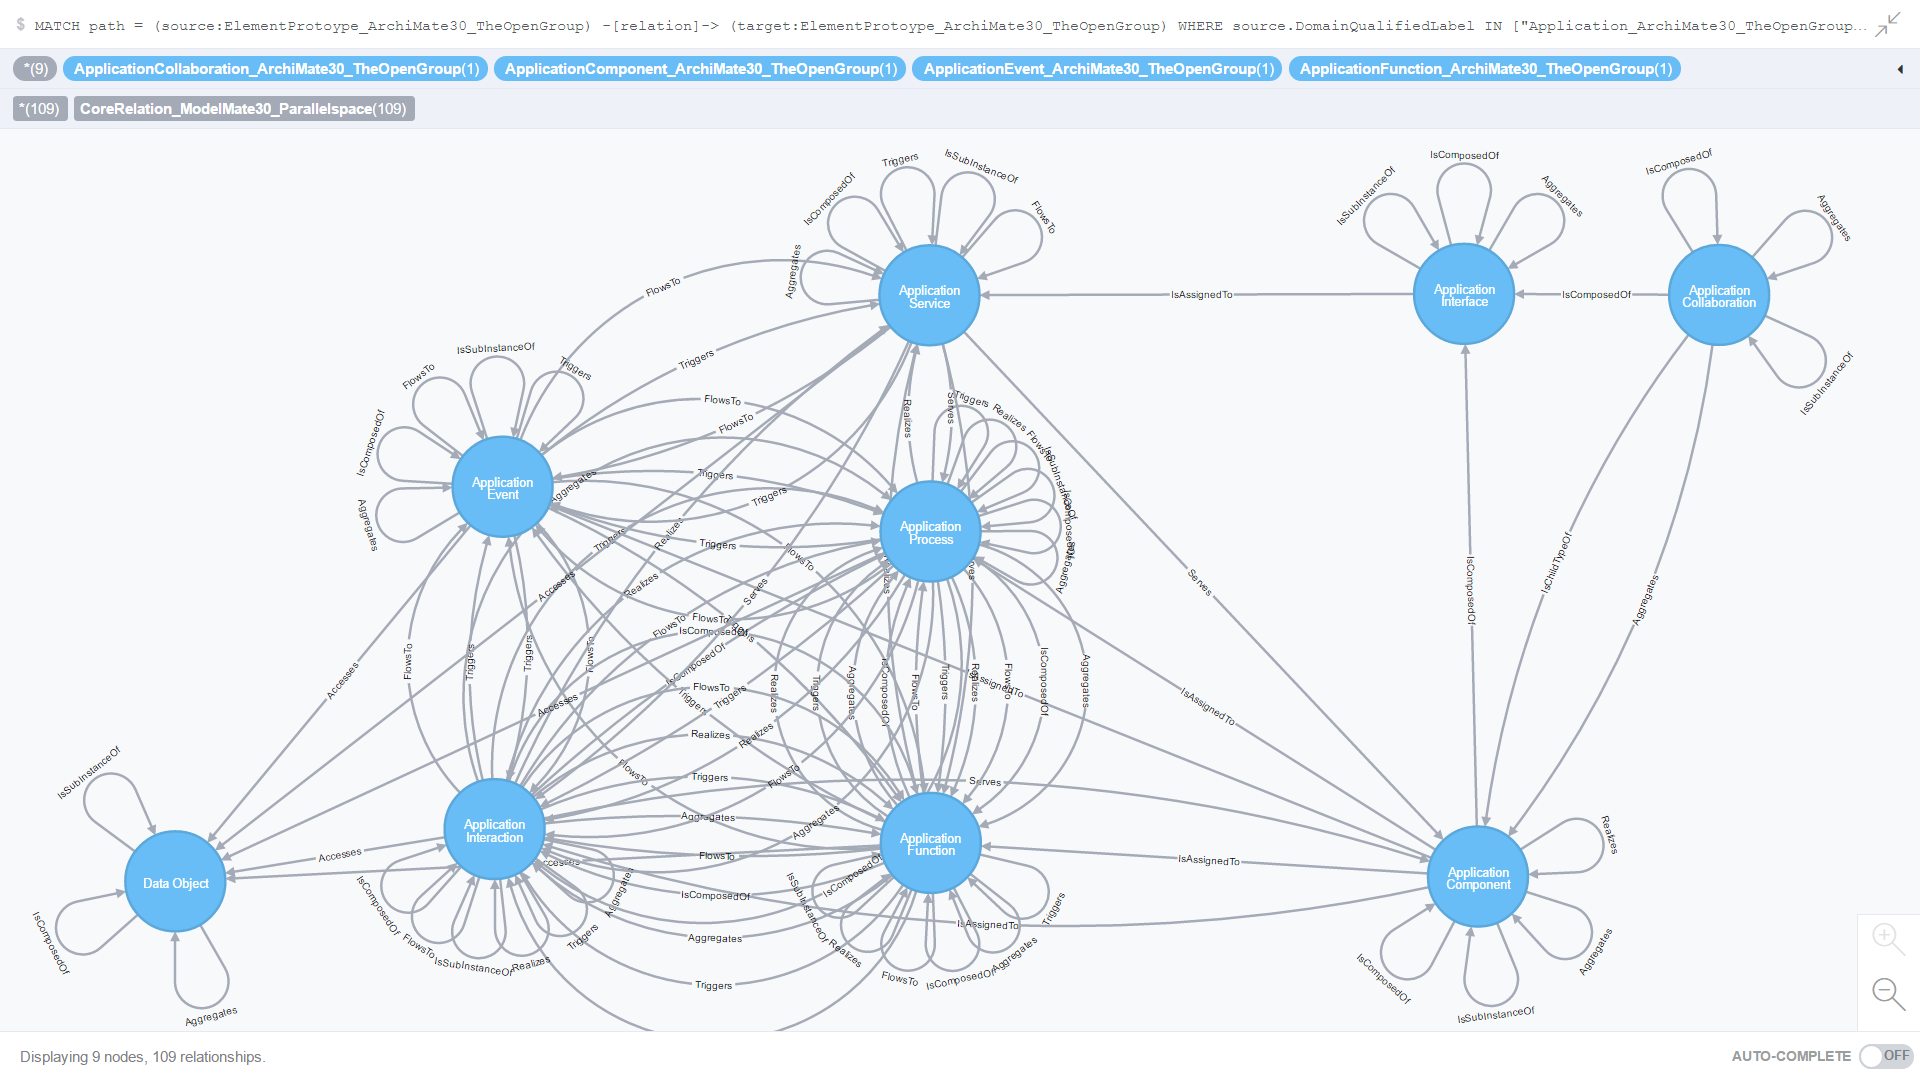
Figure 12. All Core relationships where the source and target element prototypes are from the Application domain

Technology Domain Use Case Results

Use Case 6: All Core and Derived relationships where the source and target element prototypes are from the Technology/Infrastructure domain

Figure 13. is the result of an ad-hoc CQL query against all Core relationships where both the source and target element prototypes are from the Technology/Infrastructure domain.

300-parallelspace_modelmate_masterdataset_complete10-technologydomain

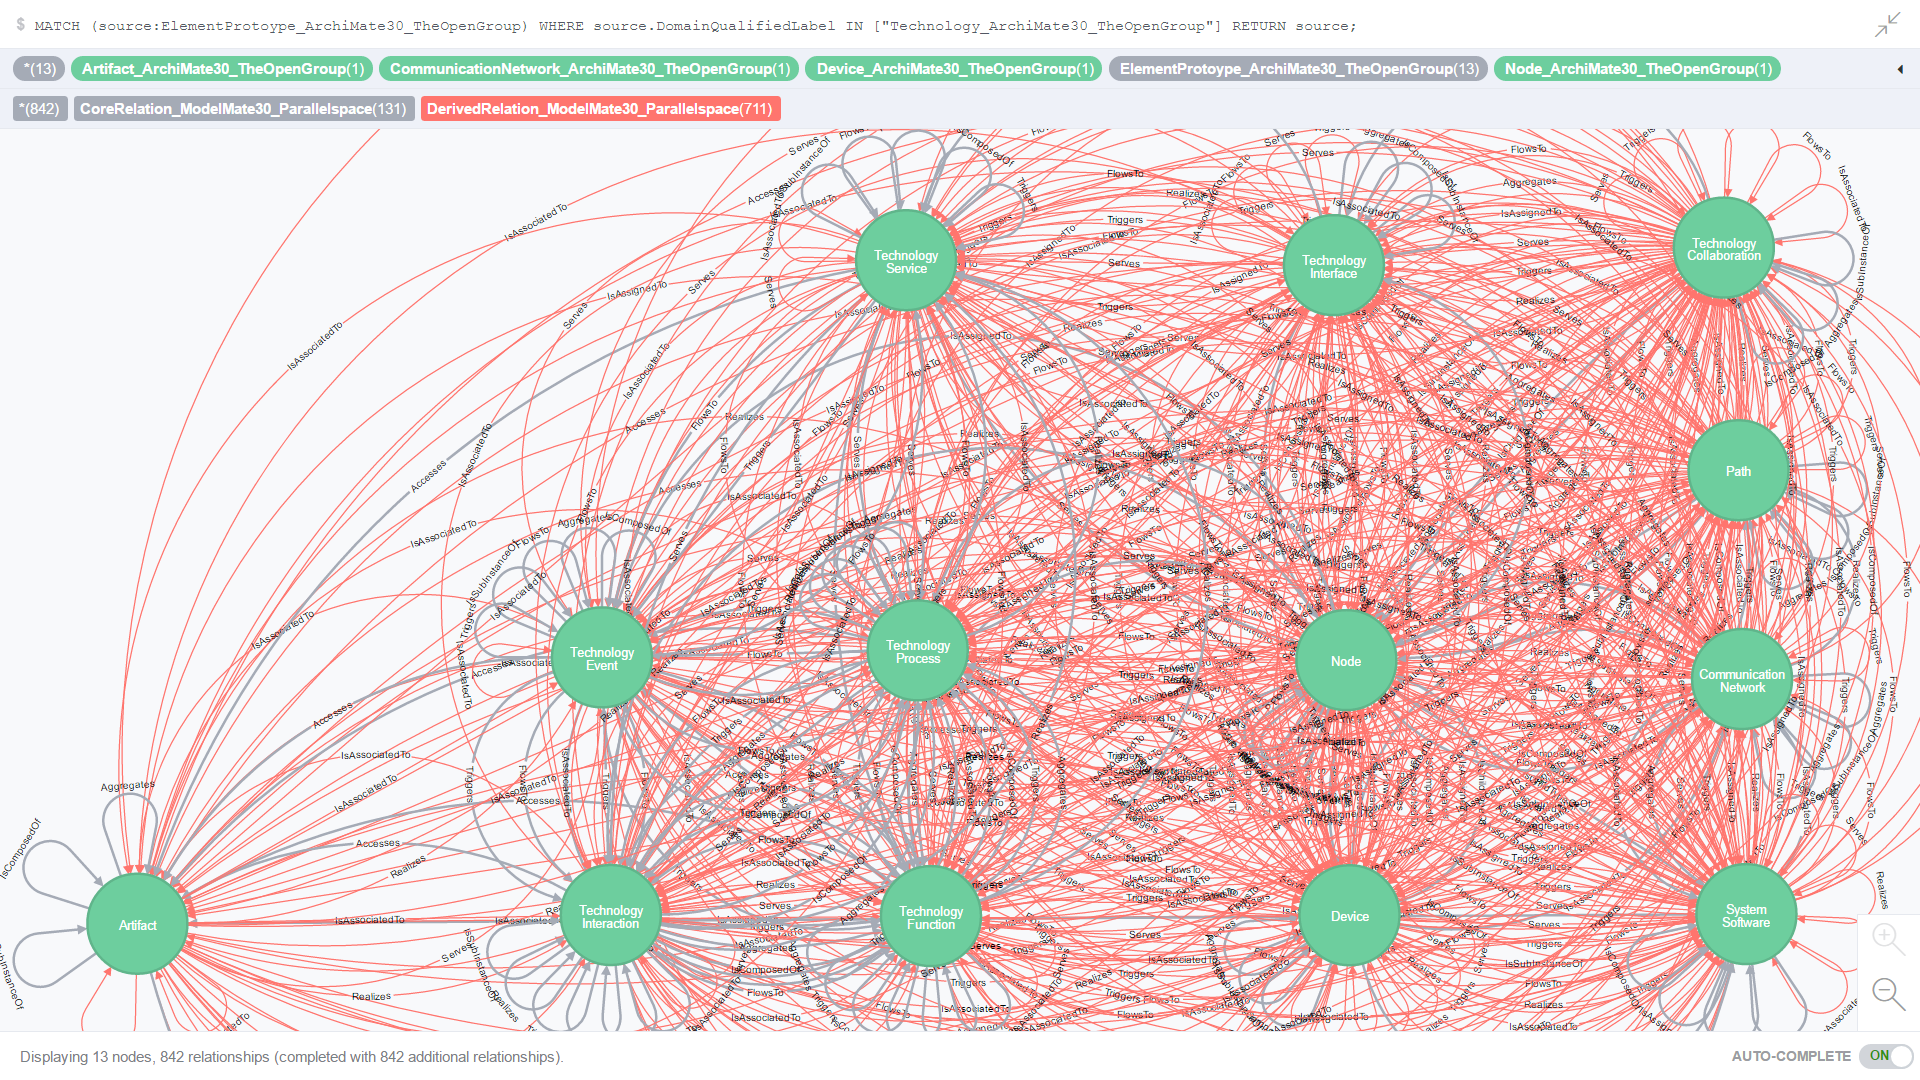
Figure 13. All Core and Derived relationships where the source and target element prototypes are from the Technology/Infrastructure domain

Use Case 7: All Core relationships where the source and target element prototypes are from the Technology domain

Figure 14. is the result of an ad-hoc CQL query against all Core relationships where both the source and target element prototypes are from the Technology domain.

330-parallelspace_modelmate_masterdataset_complete10-technologydomain3

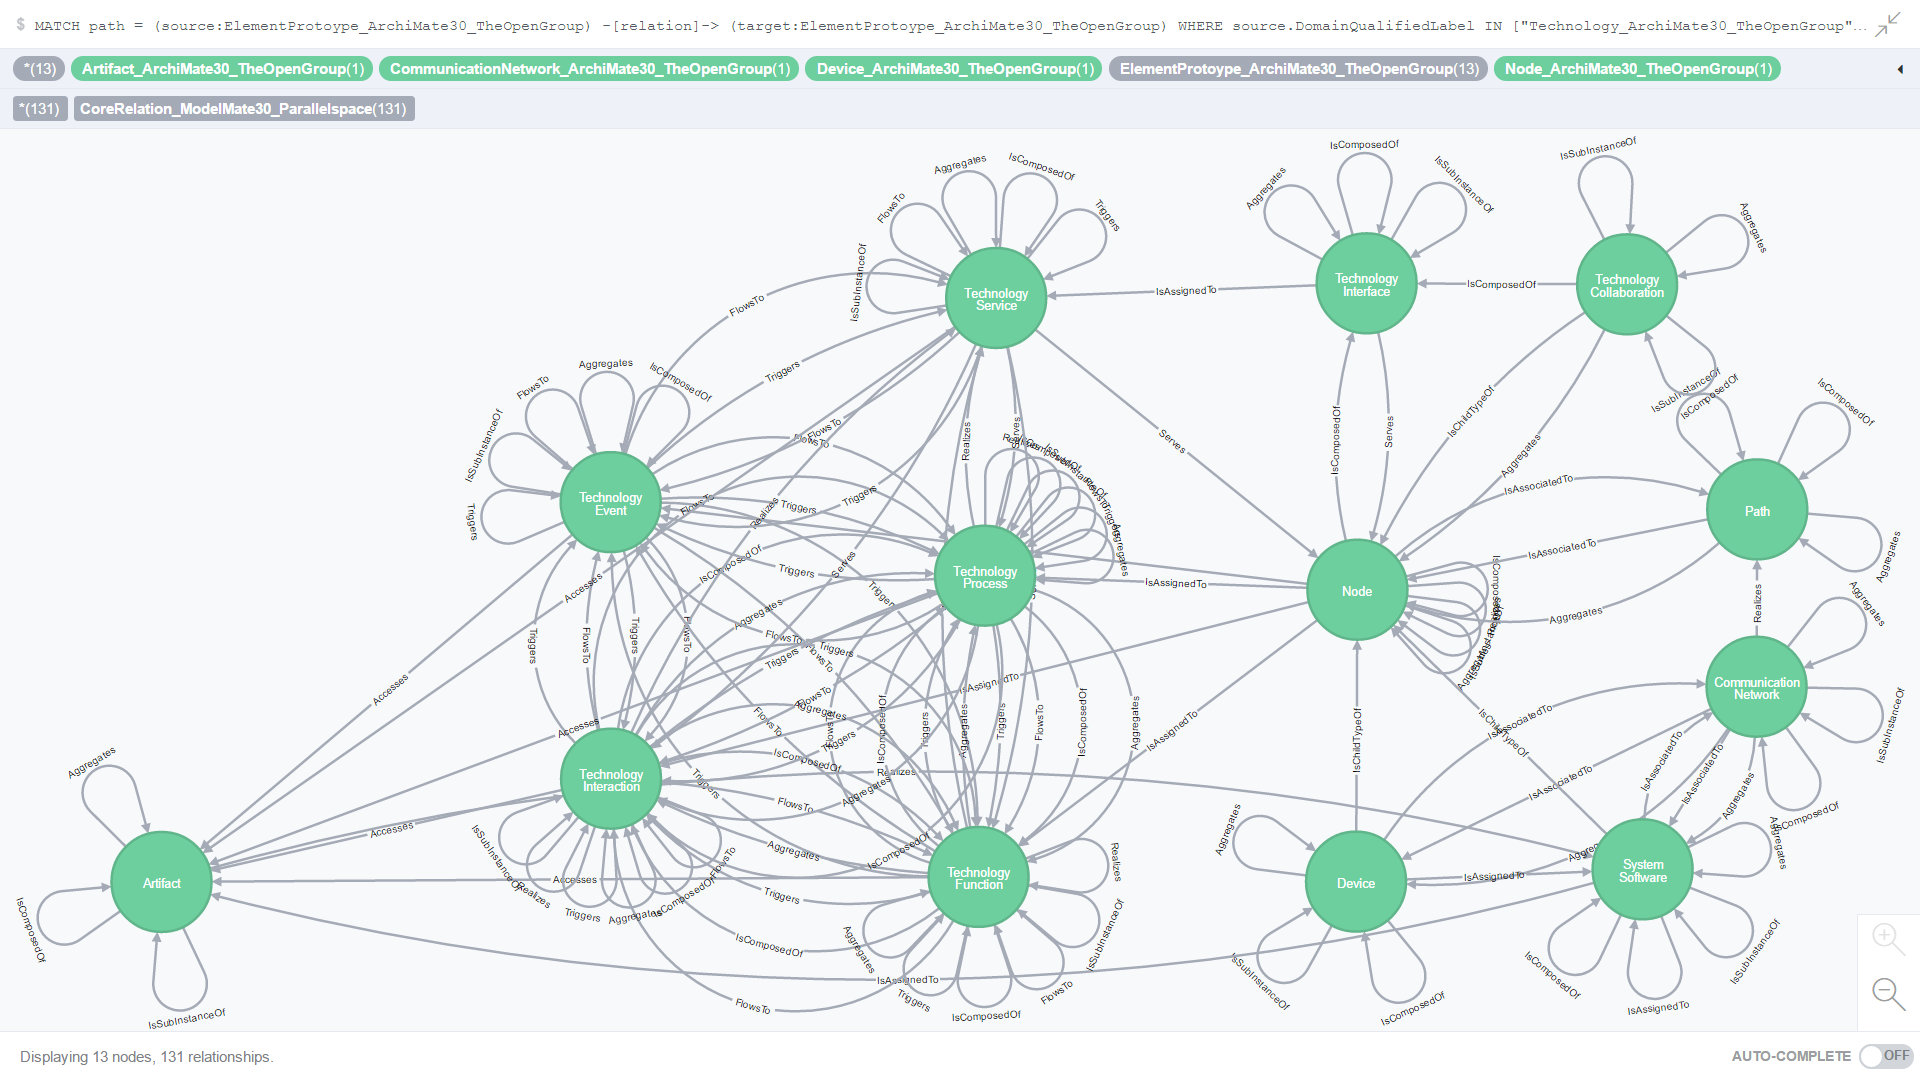
Figure 14. All Core relationships where the source and target element prototypes are from the Technology domain

Use Case 8: All Core relationships where the source and target element prototypes are from the Technology domain and are identical to each other

Figure 15. is the result of an ad-hoc CQL query against all Core relationships where both the source and target element prototypes are from the Technology domain and are identical to each other.

340-parallelspace_modelmate_masterdataset_complete10-technologydomain5

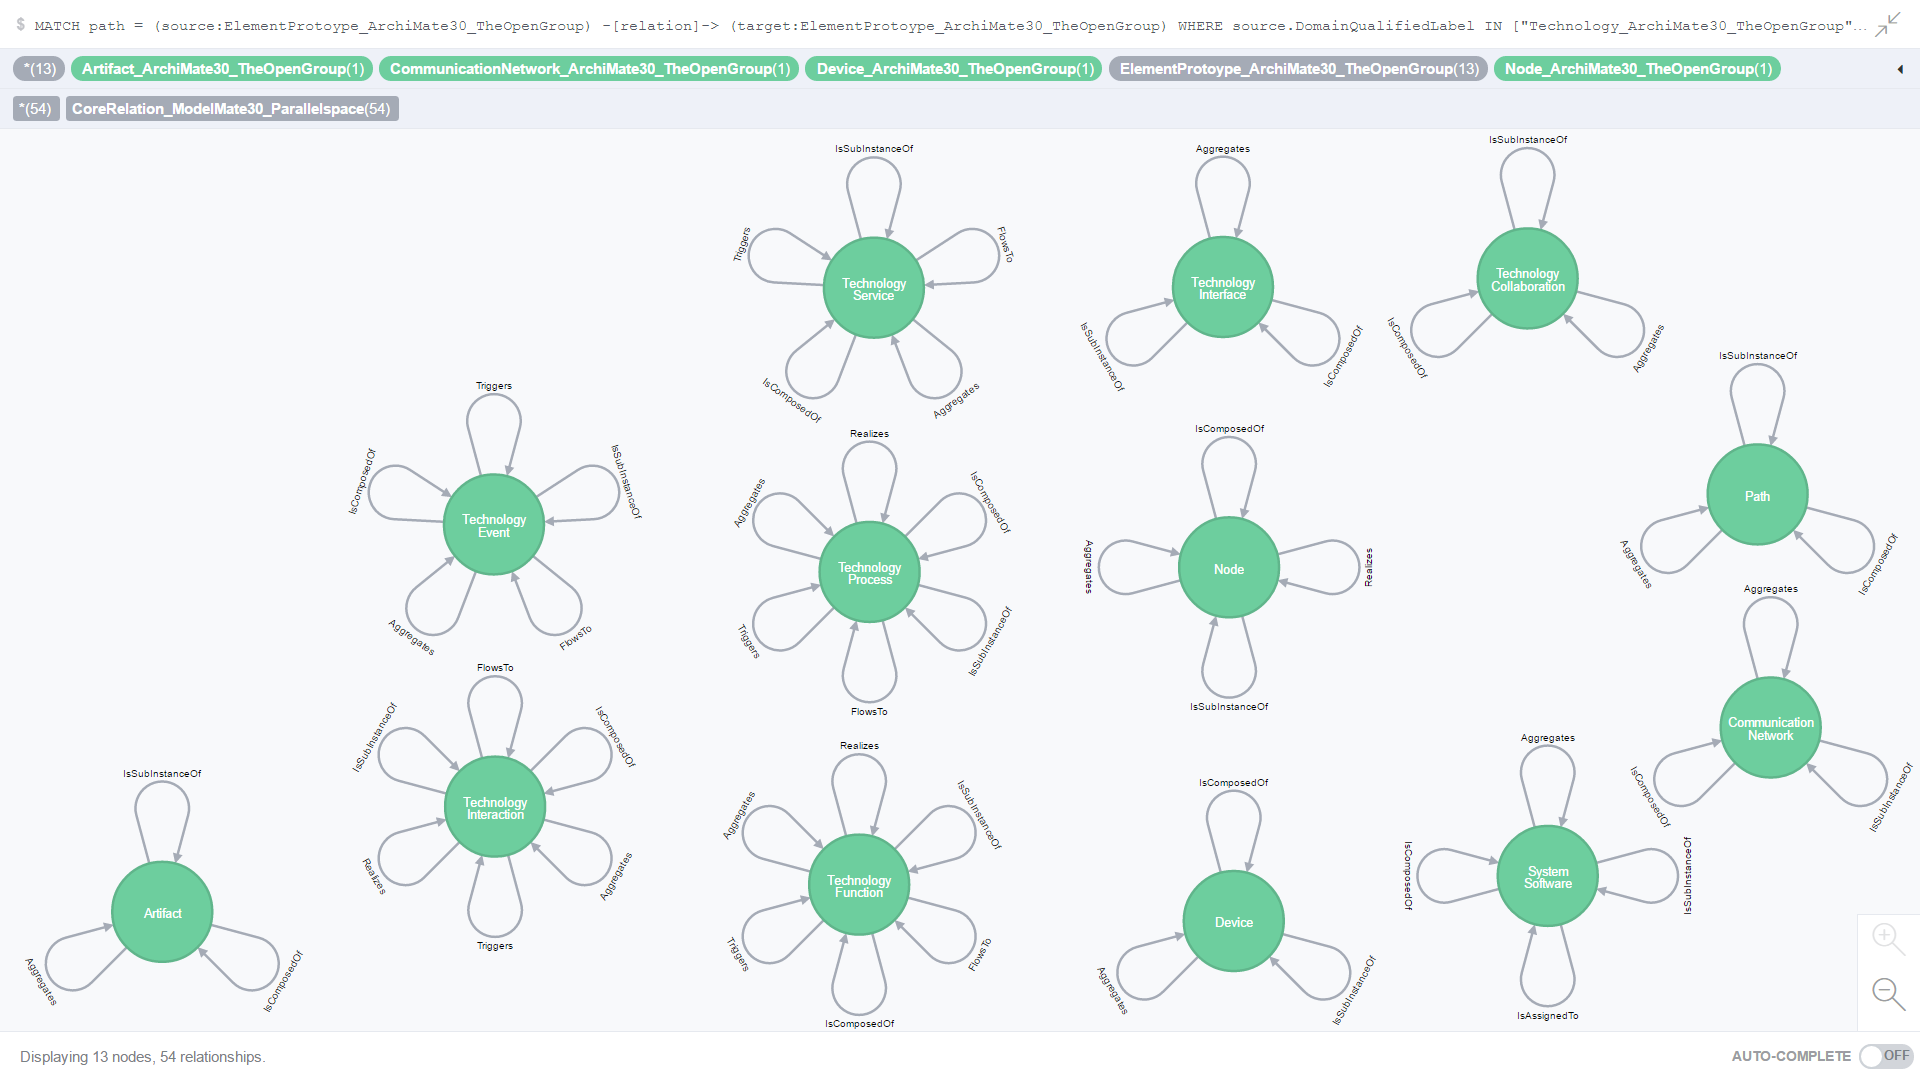
Figure 15. All Core relationships where the source and target element prototypes are from the Technology domain and identical to each other

Use Case 9: All Core relationships where the source and target element prototypes are from the Technology domain and are different from each other (non-self referencing)

Figure 16. is the result of an ad-hoc CQL query against all Core relationships where both the source and target element prototypes are from the Technology domain and are different from each other (non-self referencing).

350-parallelspace_modelmate_masterdataset_complete10-technologydomain4

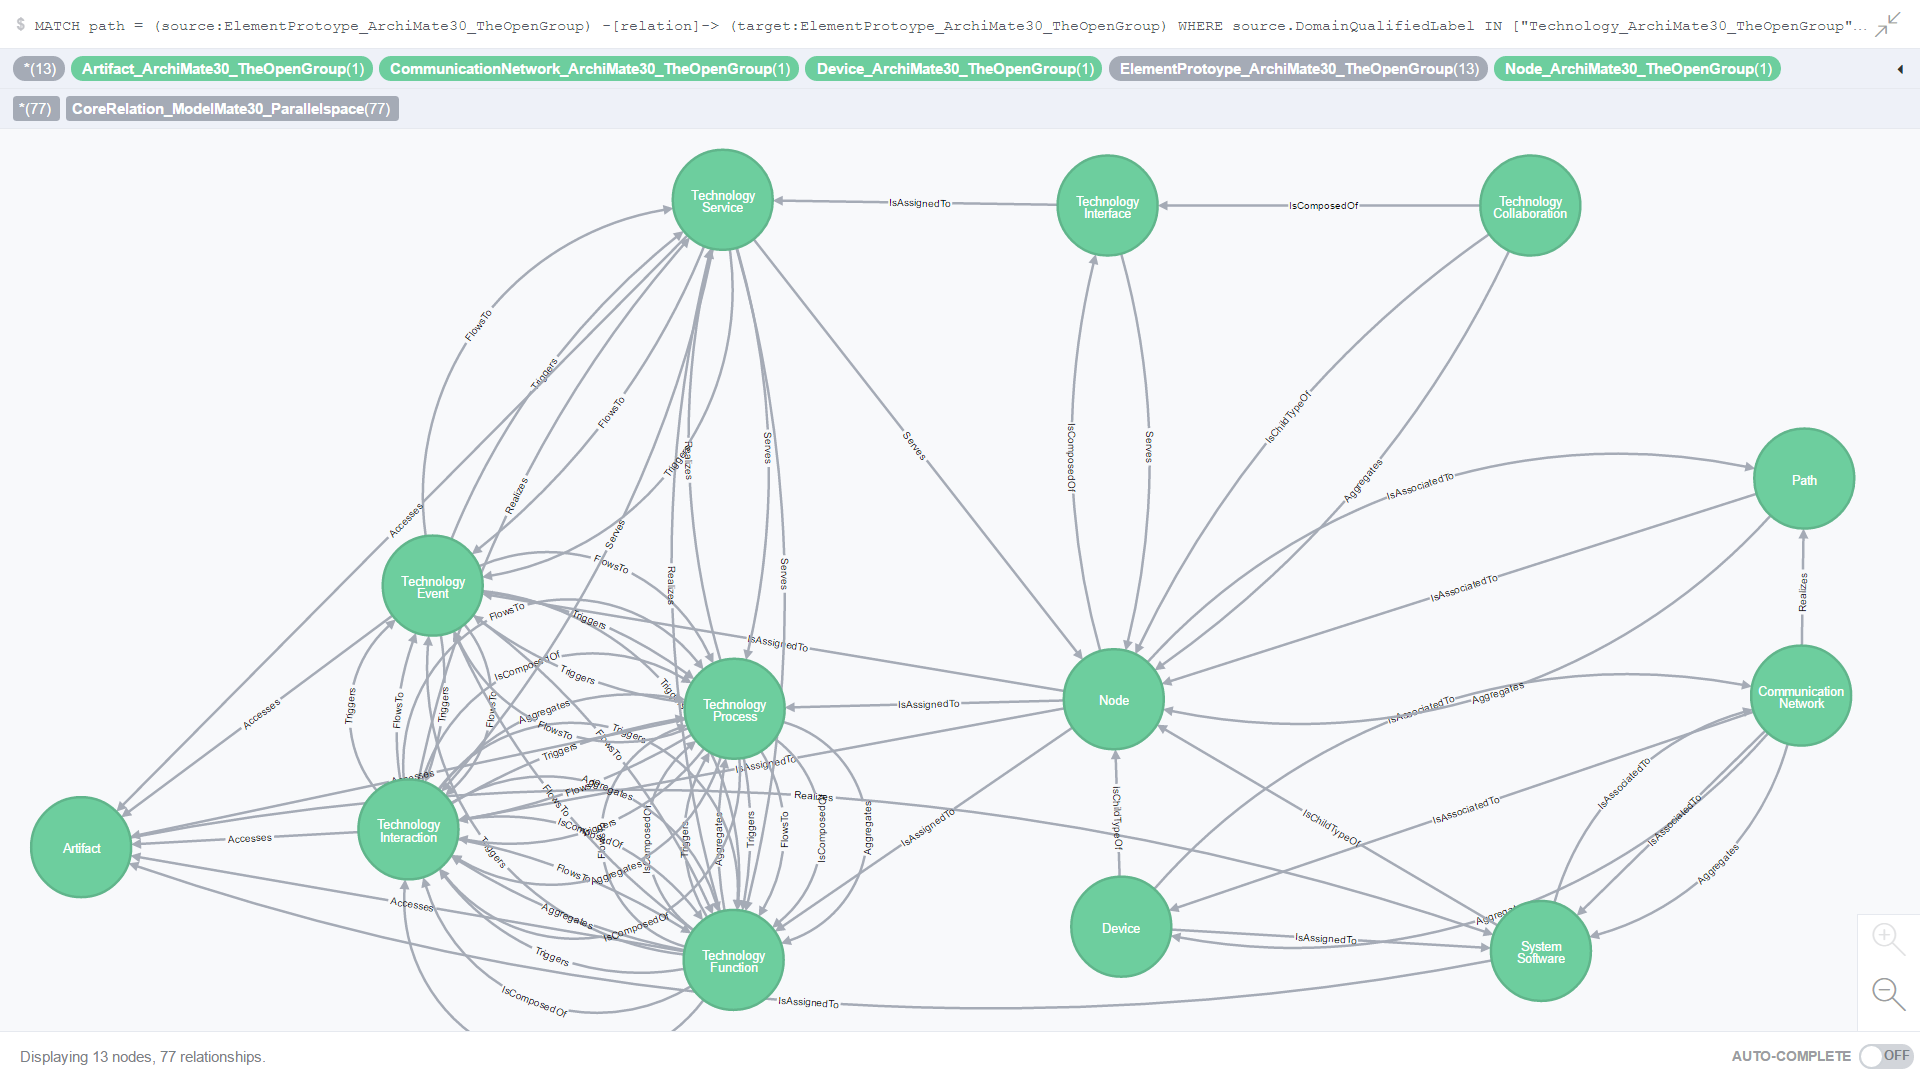
Figure 16. All Core relationships where the source and target element prototypes are from the Technology domain and different from each other (non-self referencing)

Use Case 10: All Core and Derived relationships where the source and target element prototypes are from the Technology domain and are different from each other (non-self referencing)

Figure 17. is the result of an ad-hoc CQL query against all Core and Derived relationships where both the source and target element prototypes are from the Technology domain and are different from each other (non-self referencing).

360-parallelspace_modelmate_masterdataset_complete10-technologydomain6

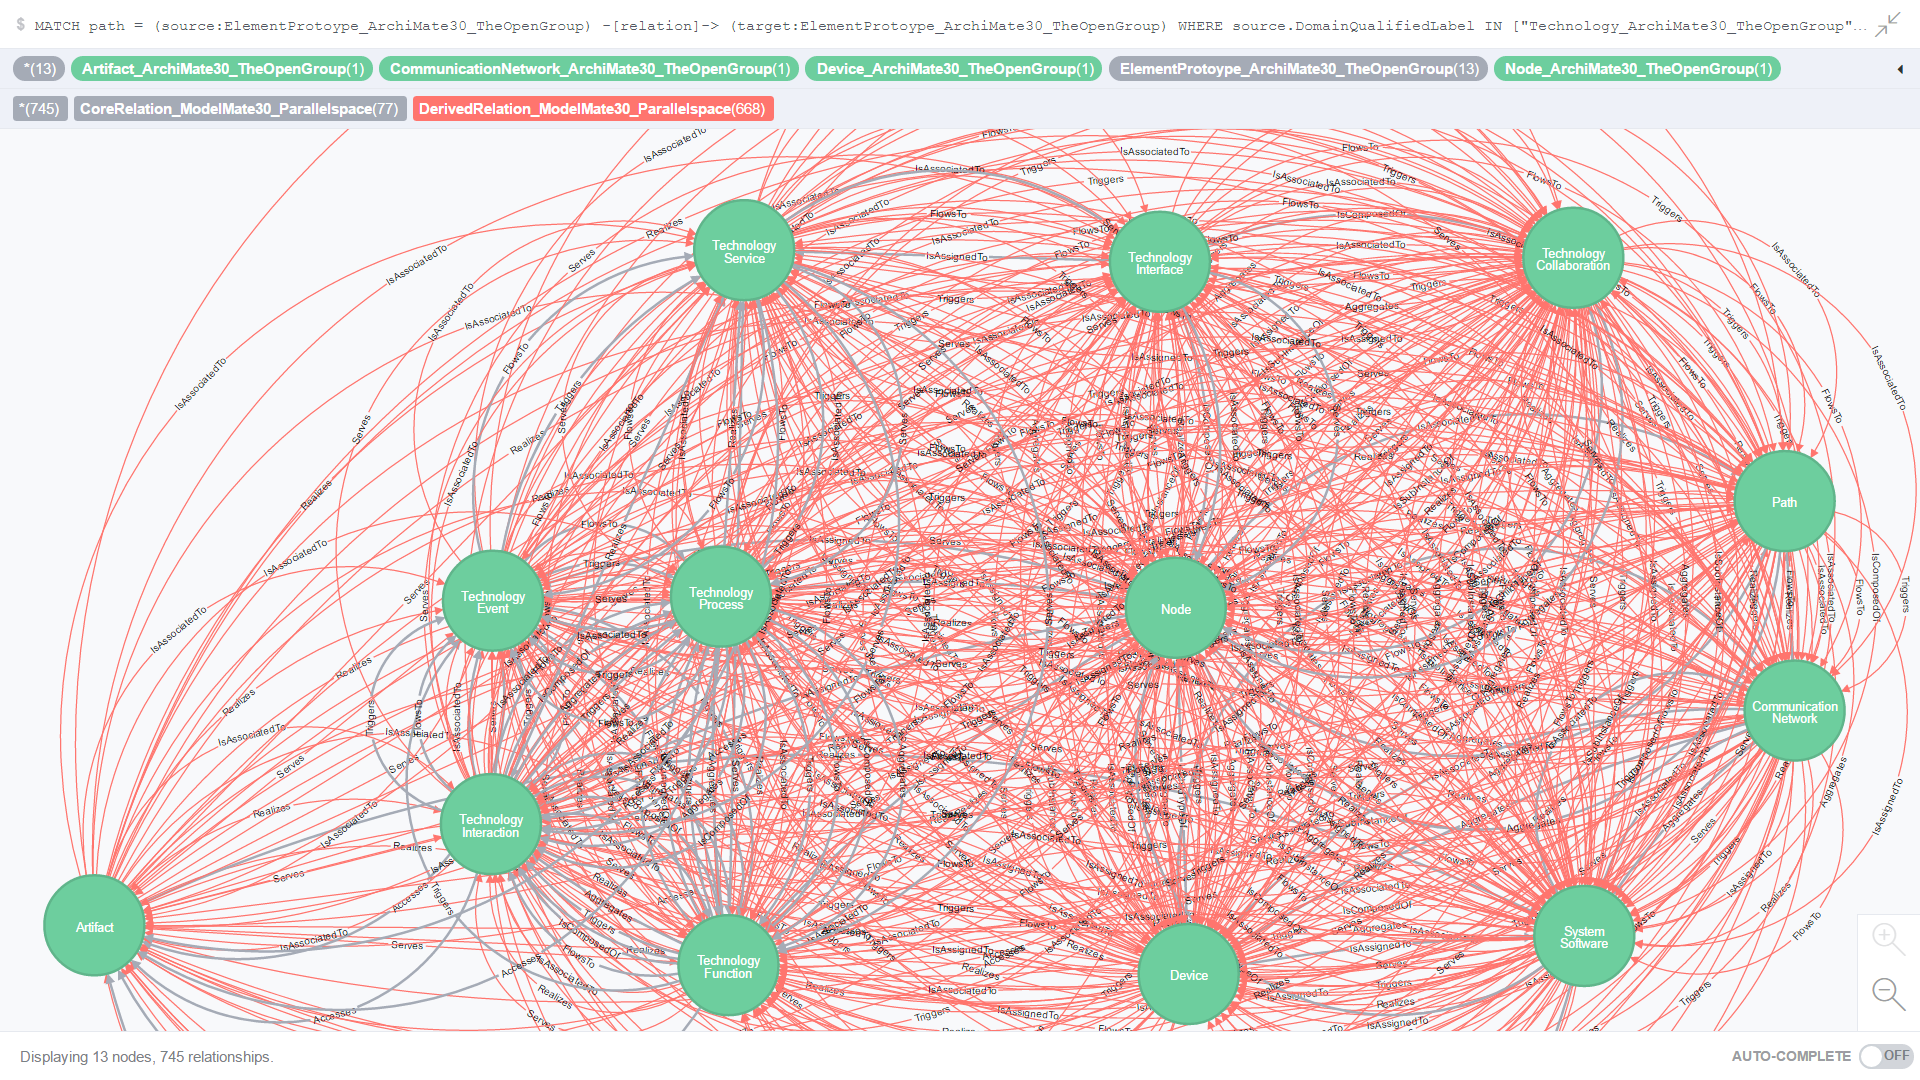
Figure 17. All Core and Derived relationships where the source and target element prototypes are from the Technology domain and are different from each other (non-self referencing)

Use Case 11: All Core and Derived relationships where the source and target element prototypes are from the Technology domain and connected to the Node element prototype

Figure 18. is the result of an ad-hoc CQL query against all Core and Derived relationships where both the source and target element prototypes are from the Technology domain and are connected to the Node element prototype.

370-parallelspace_modelmate_masterdataset_complete10-technologydomain7

Figure 18. All Core and Derived relationships where the source and target element prototypes are from the Technology domain and connected to the Node element prototype

Aspects Use Case Results: Passive Structure, Active Structure, Behavior

Use Case 12: All Core relationships where the source and target element prototypes belong to the Passive Structure aspect

Figure 19. is the result of an ad-hoc CQL query against all Core relationships where the source and target element prototypes belong to the Passive Structure aspect.

410-parallelspace_modelmate_masterdataset_complete10-passivestructure1

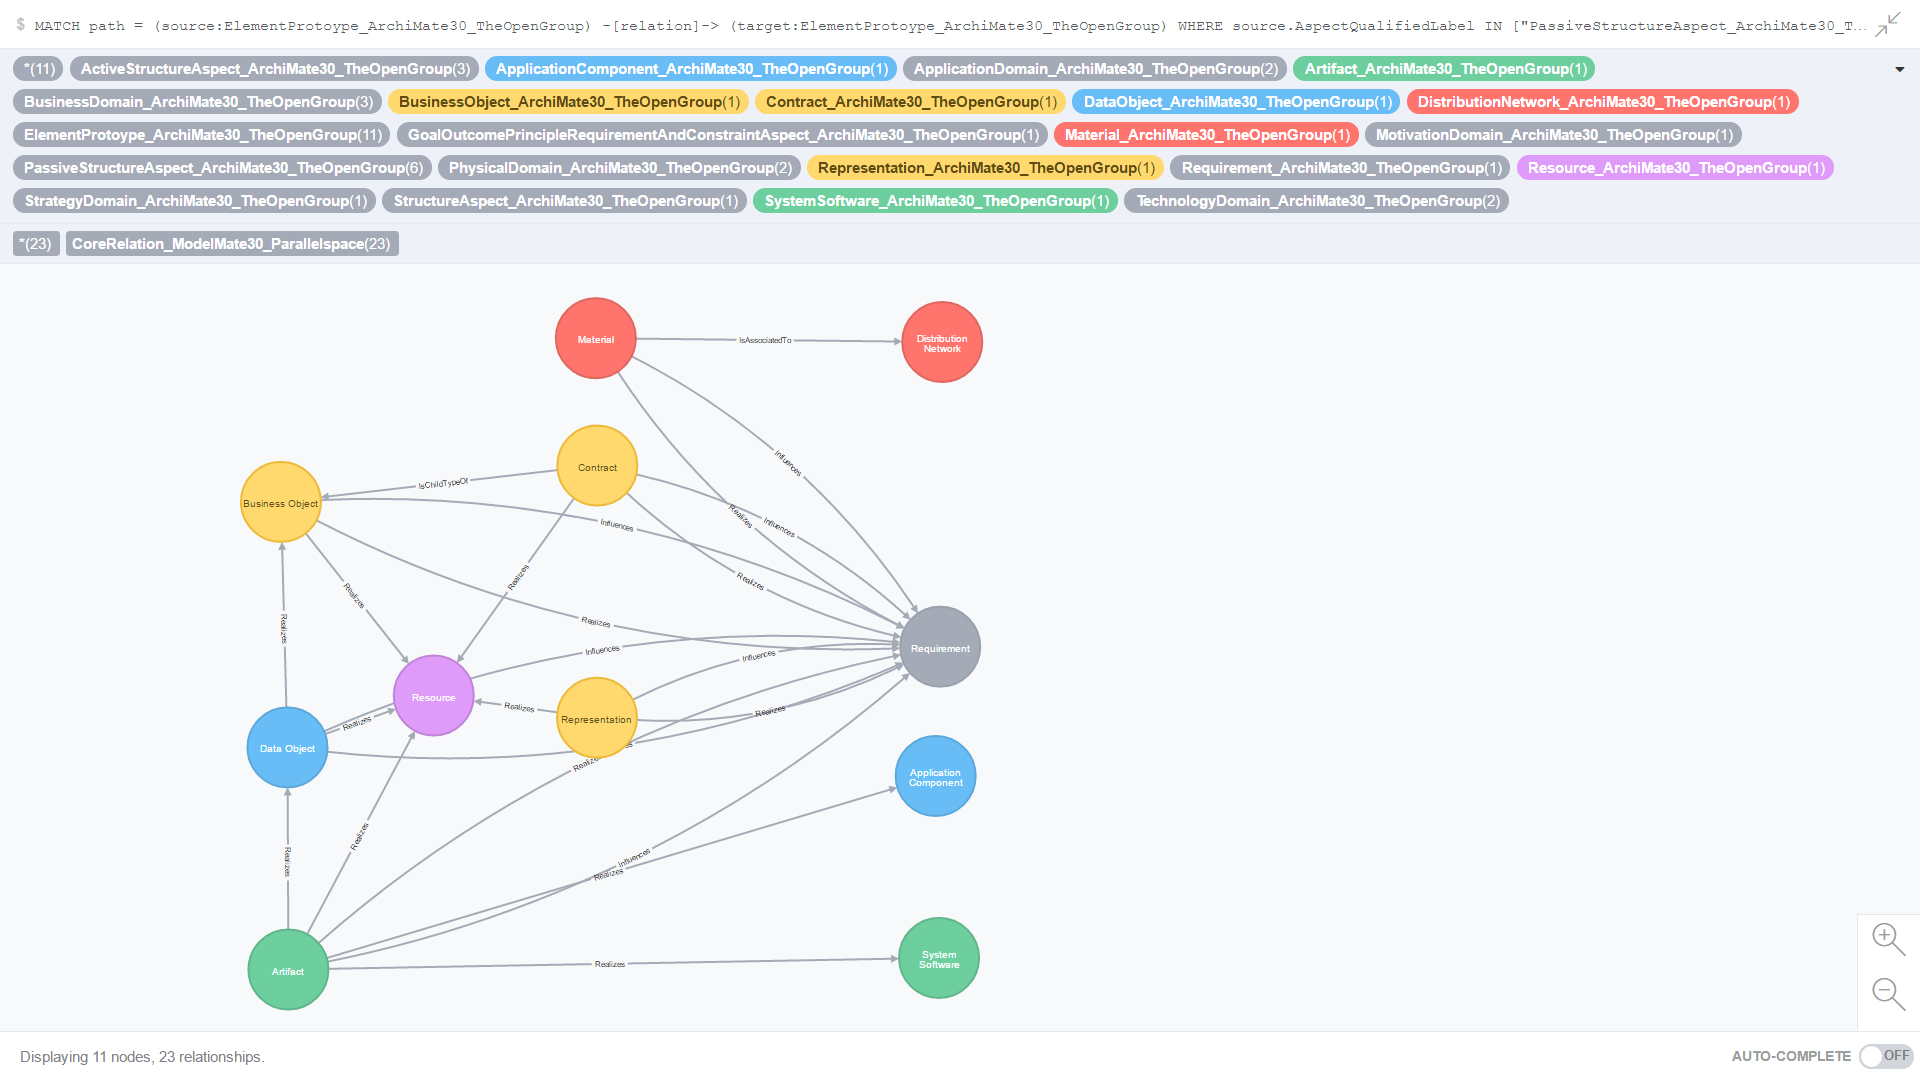
Figure 19. All Core relationships where the source and target element prototypes belong to the Passive Structure aspect

Use Case 13: All Core relationships where the source and target element prototypes belong to the Active Structure aspect

Figure 20. is the result of an ad-hoc CQL query against all Core relationships where the source and target element prototypes belong to the Active Structure aspect.

420-parallelspace_modelmate_masterdataset_complete10-activestructure1

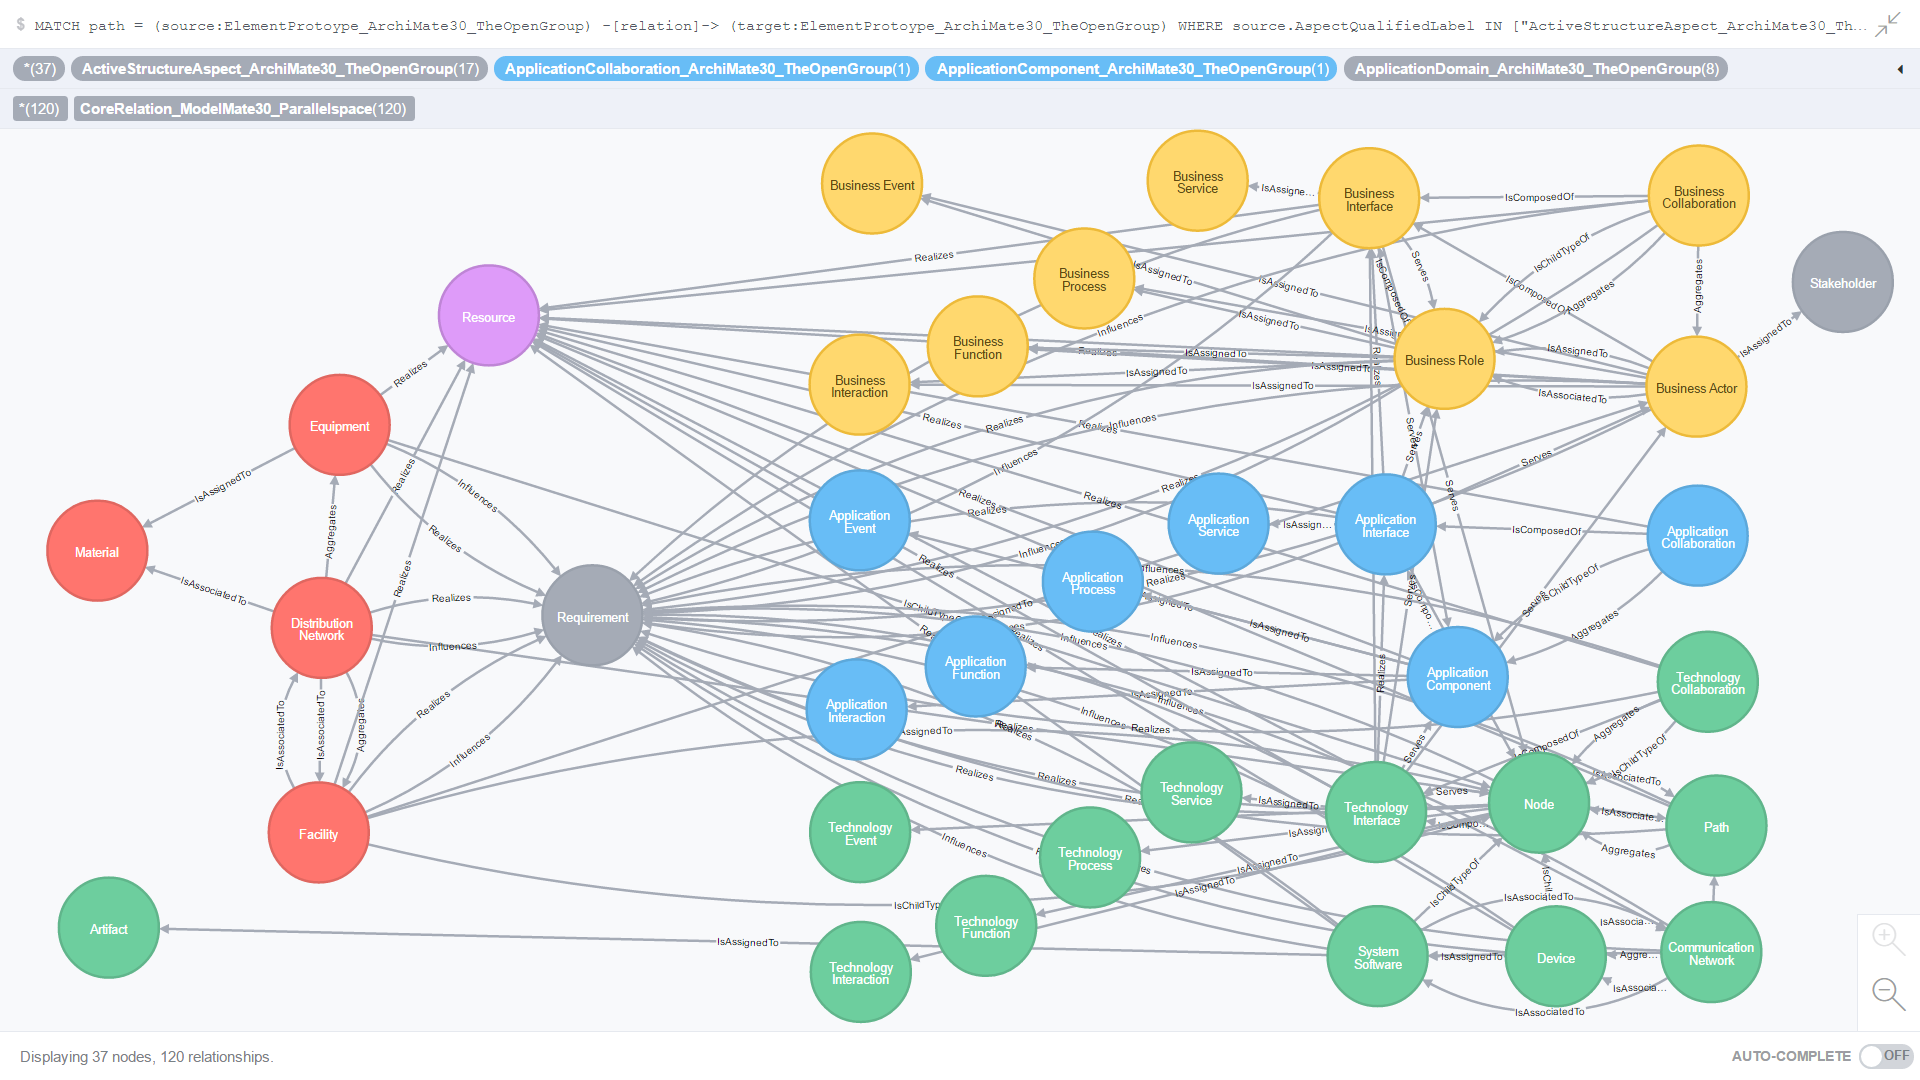
Figure 20. All Core relationships where the source and target element prototypes belong to the Active Structure aspect

Use Case 14: All Core relationships where the source and target element prototypes belong to the Behavior aspect

Figure 21. is the result of an ad-hoc CQL query against all Core relationships where the source and target element prototypes belong to the Behavior aspect.

430-parallelspace_modelmate_masterdataset_complete10-behavior1

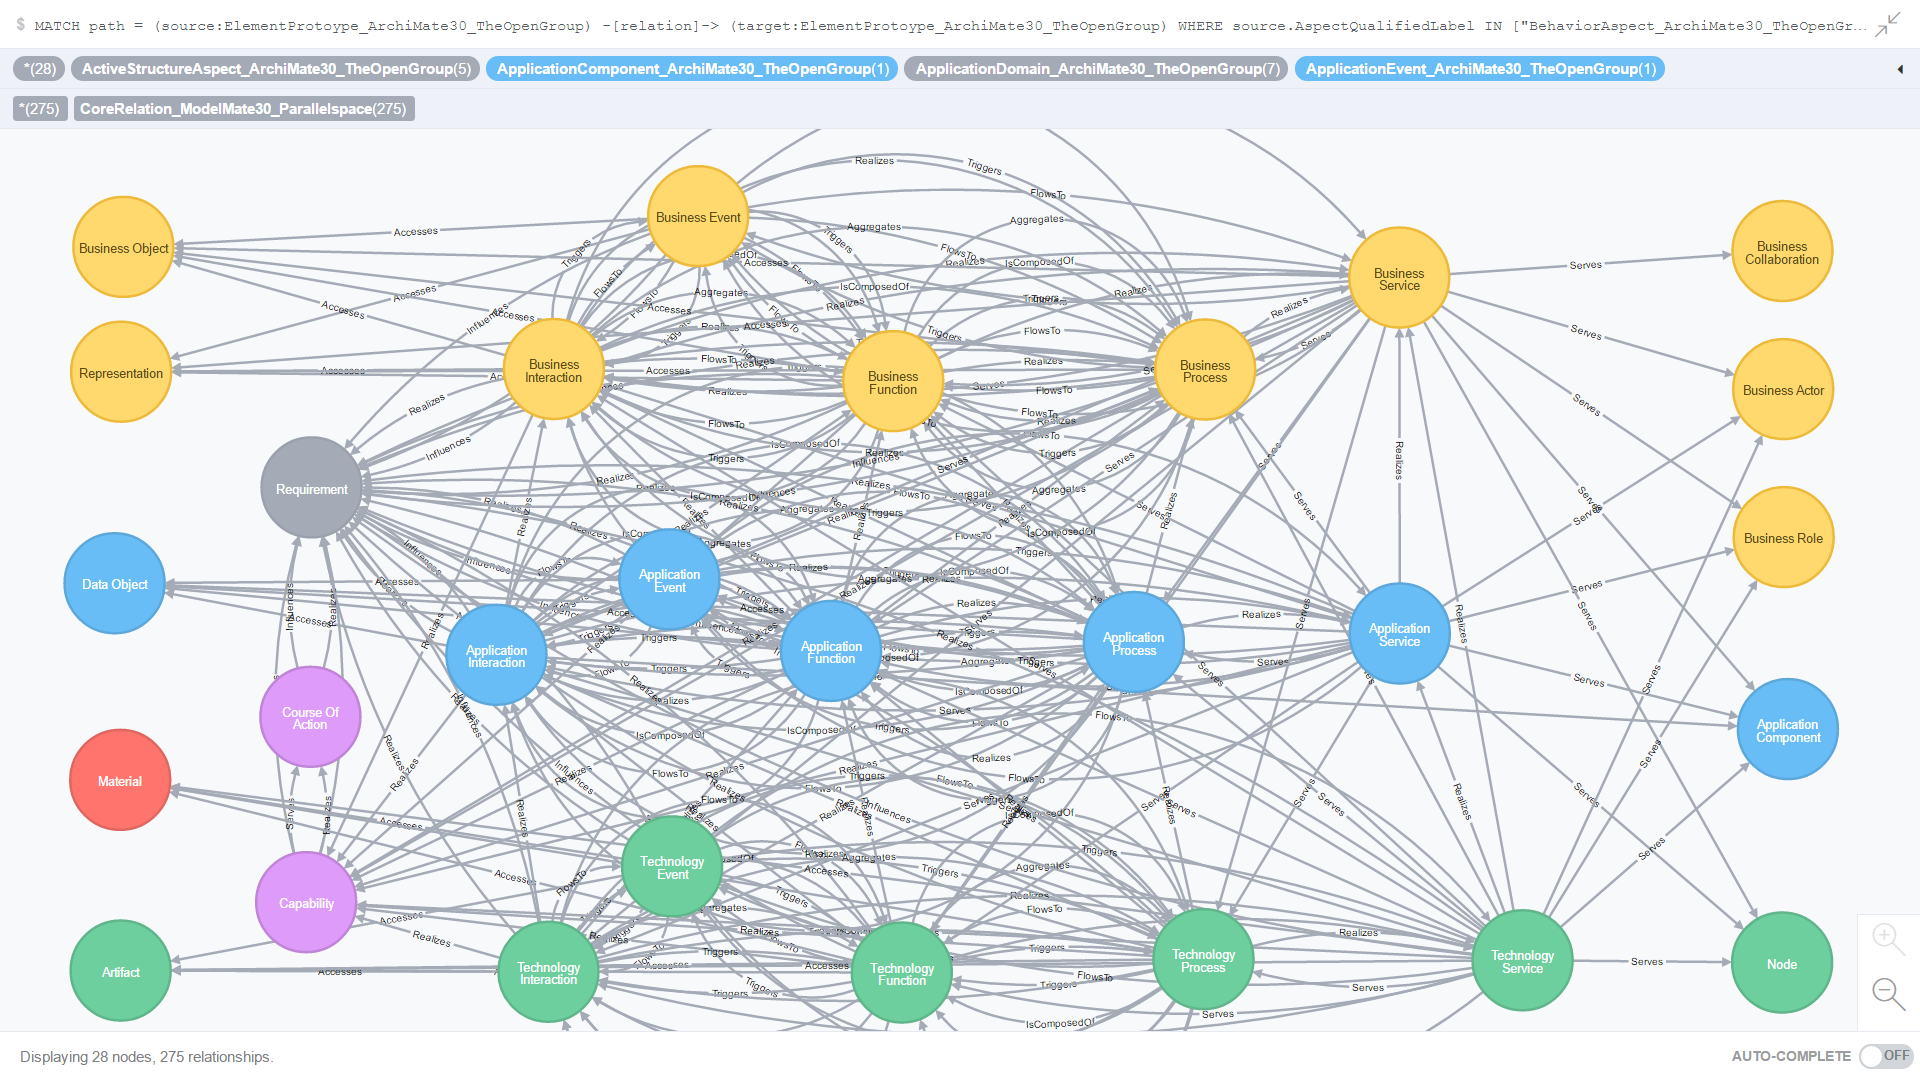
Figure 21. All Core relationships where the source and target element prototypes belong to the Behavior aspect

Feedback

Please add your comments and feedback to the end of this article.

Best regards,
Michael Herman (Toronto)
Parallelspace Corporation
mwherman@parallelspace.net

*ArchiMate is a registered trademark of The Open Group.

1 Comment

Filed under ArchiMate, Architecture Reference Models, Automated Enterprise Architecture Modeling, Crossing the EA Charm, Definitions, Domain Specification Languages (DSL), Enterprise Architecture, Enterprise Architecture Chasm, graph database, Graphitization, ModelMate, ModelMate Information Architecture for ArchiMate, ModelMate Information Architecture for Languages, Progressive Enterprise Architecture Map (PEAM), The Open Group

#Graphitization of the Enterprise

COPYRIGHT © 2016-2017 by Michael Herman, Toronto Canada. All rights reserved. [Updated June 16, 2018]

This article is the first in a series on #Graphitization. Click here to explore the other articles in this series.

Reprinted from #Graphitization of the Enterprise on LinkedIn.

Move beyond digitalization of the enterprise to graphitization of the enterprise. Here’s a great diagram that explains this concept. (click on the diagram to enlarge it)

graphitization-new-world-of-it
Figure 1. The New Model of IT

Graphitization of not only all of your corporate information assets across all of your constituencies and stakeholders – at the data, application entity, and business object level – but also the graphitization of all of the interconnections between every business process, application system, infrastructure component, cloud service, vendor/service provider, and business role that uses, manages, or stores corporate information (Crossing the EA Chasm: Automating Enterprise Architecture Modeling #2).

Use graphitization to make your existing corporate information more available, more usable, and more informative. Graphitization enables you to “Keep Calm and Have IT Your Way“.

What is #Graphitization?

#Graphitization is a data science and enterprise architecture-inspired framework and process model for modeling, ingesting, organizing, analyzing, and visualizing any domain of endeavor by using graphs – networks of connected objects and relationships with each object and relationship annotated with additional descriptive information (metadata).

The primary applications of #Graphitization are:

  • System optimization,
  • Systems life cycle management, and
  • Transformative Change in resulting in positive increases in business value for the system being studied.

A system is defined as any collection of strategies, system components, assets, architectures or processes.

Using #Graphitization

Use graphitization of your organization to help close both the Enterprise Architecture Chasm and the Operational Data Chasm. See below.

progressive-ea-model-1-0-11-peam4-operational-data-chasm
Figure 2. Continuous Transformation Framework: Enterprise Architecture Chasm and Operational Data Chasm

progressive-ea-model-1-0-11-peam5-1010
Figure 3. Continuous Transformation Framework: Process Groups and Activities

To learn more about other applications of graphitization, check out the following articles:

Best regards and best wishes for the New Year,

Michael Herman (Toronto)
Parallelspace Corporation
mwherman@parallelspace.net

6 Comments

Filed under continuous transformation, Crossing the EA Charm, Data Science, Digital Transformation, Enterprise Architecture, Enterprise Architecture Chasm, Graphitization, ModelMate, Operational Data Chasm, Progressive Enterprise Architecture Map (PEAM)

#Graphitization of Ray Dalio’s Principles: Iteration 2

COPYRIGHT © 2016-2017 by Michael Herman, Toronto Canada. All rights reserved.

This article is the third in a series on #Graphitization. Click here to explore the other articles in this series.

Iteration 2 is a small iteration that had a goal of improved key phrase-based exploration and visualization of The Principles of Ray Dalio.  This iteration builds on the ModelMate model of The Principles described earlier in this series: #Graphitization of Ray Dalio’s Principles: Iteration 1 and represents a significant improvement in terms of understanding which principles are realized by specific combinations of key phases.

Iteration 2 uses the same query used in Iteration 1. This time, the Linkurious graph visualization app is used to display the subgraph of all Topics, Principles, Subprinciples, Commentary, Questions, etc. directly or indirectly related to the key phrases “radically” and “transparent”. This concept is represented by the following simple query:

MATCH path =
 (pub:Publication_Principles_RayDalio_ModelMate)-[*]->(principle)
 -[r:HAS_KEYPHRASE]->(phrase:KeyPhase_Principles_RayDalio_ModelMate)
 WHERE phrase.Phrase CONTAINS "radical"
 OR phrase.Phrase CONTAINS "transparen"
 RETURN path;

The Principles subgraph containing all elements that are directly or indirectly related to the key phrases “radically” and “transparent” is shown below (click to enlarge).

ModelMate-Ray-Dalio-Radically Transparent.png

Figure 1. All Topics, Principles, Subprinciples, etc. with Traceability to the Key Phases “radically” and “transparent”

The underlying graph is implemented using the ModelMate framework and implemented using the Neo4j graph database.

Best regards,

Michael Herman (Toronto)
Parallelspace Corporation
mwherman@parallelspace.net

7 Comments

Filed under Automated Enterprise Architecture Modeling, continuous transformation, Data Science, Graphitization, How do we think, ModelMate, Progressive Enterprise Architecture Map (PEAM)

#Graphitization of Ray Dalio’s Principles: Iteration 1

COPYRIGHT © 2016-2017 by Michael Herman, Toronto Canada. All rights reserved.

[If you “only want to see the pictures”, scroll down to Figure 4.]

This article is the second in a series on #Graphitization. Click here to explore the other articles in this series.

Background

ray-dalioRay Dalio is Chairman & Chief Investment Officer at Bridgewater Associates, L.P., the world’s largest hedge fund, and is well known for The Principles that he and his colleagues at Bridgewater use to govern themselves and each other. Mr. Dalio has published the 200+ Principles in a 123-page document and made the content publically available on a dedicated website: Principles by Ray Dalio (“The Principles”). Here is his description of The Principles…

“What is written here is just my understanding of what it takes: my most fundamental life principles, my approach to getting what I want, and my “management principles,” which are based on those foundations. Taken together, these principles are meant to paint a picture of a process for the systematic pursuit of truth and excellence and for the rewards that accompany this pursuit. I put them in writing for people to consider in order to help Bridgewater and the people I care about most.”

I encourage you to read more of his Introduction here.

What is #Graphitization?

#Graphitization is a data science and enterprise architecture framework and process model for modeling, ingesting, organizing, analyzing, and visualizing any domain of endeavor by using graphs – networks of connected objects and relationships with each object and relationship annotated with additional descriptive information (metadata).

The primary applications of #Graphitization are:

  • System optimization,
  • Systems life cycle management, and
  • Transformative Change in resulting in positive increases in business value for the system being studied.

A system is defined as any collection of strategies, system components, assets, architectures or processes.

In the article #Graphitization of the Enterprise, I’ve provided a number of illustrations of how one field of endeavor, the continuous transformation of large enterprise organizations, can benefit from #Graphitization. My blog contains several additional examples of #Graphitization applied to traditional enterprise architecture; for example, Crossing the EA Chasm: Automating Enterprise Architecture Modeling #2.

Why not try applying #Graphitization to something completely different?

#Graphitization of Ray Dalio’s Principles

A few weeks ago (December 22, 2016), the Wall Street Journal published an article (The World’s Largest Hedge Fund Is Building an Algorithmic Model From its Employees’ Brains) which describes Mr. Dalio’s vision for creating “The Book of the Future.”

“One employee familiar with the project described it as “like trying to make Ray’s brain into a computer.””

2 + 2 = ?  You guessed it. Why not try to graphitize part of Mr. Dalio’s brain?

That is, why not try to turn The Principles into a computer model that documents each Principle, its hierarchical inter-relationships, and, via some sophisticated cloud-based text analysis services, visualize all of the important interconnections based on a set of computer-chosen key phrases?

This article documents Iteration 1 of the #Graphitization of Ray Dalio’s Principles.

Wisdom in, Wisdom out

Today, there are several easy-to-use technologies that enable developers to view web pages as sophisticated databases.  The Principles website (a single web page) is no exception.

A simple query like the one below makes it is easy to exact the hierarchy of Sections, Topics, Principles, Subprinciples, Summary Paragraphs, Questions, Bullets, Figures, etc. from The Principles using a single statement.

modelmate-ray-dalio-html-query

Figure 1. The Principles Web Page Query

A sample portion of The Principles web page appears below and has the following structure:

  • “To Get The Culture Right…” is a Section. There are 4 Sections at the top level of the Publication.
  • “TRUST IN TRUTH” is a Topic and it is also a numbered Principle.
  • “Realize that you have nothing to fear from truth.” is a numbered Principle.
  • Principles can contain numbered Subprinciples.
  • Topics, Principles, and Subprinciples can have (unnumbered) Summary Paragraphs, Questions, Bullets, Figures, etc.

Topics, Principles, and Subprinciples are numbered sequentially; there is no hierarchical numbering scheme.

Ray-Dalio-Principles-radically-transparent-web.png

Figure 2. Web Page Sample: The Principles By Ray Dalio

In my ModelMate model for The Principles, 3 classes of key phrases are used to cross-index each Topic, Principle, Subprinciple, etc.

  1. Key Topics – short phrases deemed to be particularly relevant and interesting across the entire document (i.e. the corpus)
  2. Key Phrases – short phrases deemed to be of particular importance within the scope of a single title, paragraph of text, question, or bullet.
  3. Other Phrases – additional key phrases chosen because they are particularly relevant to Bridgewater, Mr. Dalio, and The Principles.

In total, there are 2470 key phases; about 200 of these are Key Topics selected by a cloud-based text analytics service, about 300 are Other Phases. The remaining Key Phrases (with a few overlaps) were selected by a different text analytics service that was run against the text of each individual Topic, Principle, Subprinciple, etc.

A sample of the ingested The Principles web page content looks like the following (click to enlarge):

exampledata-keyphrases

Figure 3. Ingested Web Page

Results of Iteration 1

The entire structure and content of The Principles was ingested during Iteration 1 of this project:

  • 210 principles comprised of 768 artifacts (titles, paragraphs, questions, bullets, …)
  • 767 structural relationships
  • 2470 key phrases
  • 6126 key phrase-principle semantic relationships

The sample queries below highlight The Principles that are related to 2 critically important concepts at Bridgewater: “radically” and “transparent” (including all words that have these words as reasonable root words).

The single line queries found all artifacts that were in some way related to the 2 key phases; then calculated the traceability up to through to the top (beginning) of The Principles (click to enlarge).

ray-dalio-principles-radically-transparent

Figure 4. All Topics, Principles, Subprinciples, etc. with Traceability to the Key Phases “radically” and “transparent”

The large orange dot represents the top (the root of the web page). The large blue dots represent the 4 top-level Sections in The Principles:

  • To Get the Culture Right…
  • To Get the People Right…
  • To Perceive, Diagnose, and Solve Problems…
  • To Make Decisions Effectively…

The green dots are Topics; the red dots are Principles; and, the purple dots are Subprinciples. Key Phrases appear as pink dots.  The gray dots are Commentary Paragraphs, Questions, Bullets, Figures, etc.

Figure 5 (below) includes some exploration (expansion) of Principal 2. Realize that you have nothing to fear from truth.

ray-dalio-principles-radically-transparent-plus

Figure 5. Principal 2. Realize that you have nothing to fear from truth.

Conclusions

In the end, extending the ModelMate platform to support the above produced more learning than what I’ve been able to glean from subsequent exploration of the #Graphitization of The Principles. Perhaps someone with more familiarity with The Principles can contact me with some interesting use cases. I’m extremely curious to derive more value from this model

This work on this project was made infinitely easier through the use of the ModelMate platform (powered by the Neo4j graph database).

To see a more meaningful visualization of The Principles, check out #Graphitization of Ray Dalio’s Principles: Iteration 2.

Best regards,

Michael Herman (Toronto)
Parallelspace Corporation
mwherman@parallelspace.net

7 Comments

Filed under Automated Application Architecture Analysis, Business Value, Data Science, Graphitization, How do we think, ModelMate, Progressive Enterprise Architecture Map (PEAM), The Principles

Crossing the EA Chasm: ArchiMate “Keep Calm and Have IT Your Way”

archimate-have-it-your-way

What would the nirvana of “Have IT Your Way” EA actually look and feel like?

First, a bit of required pre-reading: check out Crossing the EA Chasm: Re-visioning the ArchiMate Specification.

My apologies if you haven’t already read the preceding article. It was part of an initial draft of this article until I realized the topic of ArchiMate customization needed to stand on its own.  It became the main course; leaving this article to be the dessert and, hence, much more enjoyable.

This article consists of alternate visualizations of the same underlying ModelMate enterprise architecture model and, for the most part, the same view.  The only variables are the modeling scheme and zoom factor used to render each view:

  • Colored dots
  • ArchiMate iconography
  • Microsoft Enterprise Viso Stencil
  • Amazon Web Services (AWS) 2D iconography
  • Amazon Web Services (AWS) 3D iconography

The first figure is an animation/slide show. It depicts a succession of views – each drawn with one of the above schemes.

This slideshow requires JavaScript.

Figure 1. Single Open EA Repository: “Have It Your Way” Views
(Dots, ArchiMate, Microsoft Enterprise Stencil, AWS 2D Icons, AWS 3D Icons)

Zoom factor is an interesting variable. In the first 2 frames of the above animation, the transition from the large scale view using the “dots” scheme to the smaller scale view using the ArchiMate scheme is one example of how different schemes can benefit from being used together in the same view. In this example, it’s the benefit of masking the detail in large scale views while allowing the detail to be unwrapped in small scale views. The benefit is more esthetically pleasing and understandable views for each range of zoom factors.

parallelspace-modelmate-archimate-detail

Figure 2. ArchiMate Icons: View Detail
(same underlying ModelMate model)

Figure 2 renders the view using the ArchiMate scheme, primarily. In addition, the colors of the dots denote the combination of schemes that are available in this ModelMate model. The top color of each dot denotes the ArchiMate element type and the bottom color denotes the element type based on a fine-grained Microsoft enterprise schema/taxonomy. For example, the highlighted component is a SQL Server Instance (denoted by the dark gray color in the top half of the dot). The yellow-green color (aided by the icon) identify the component as an ArchiMate infrastructure service. (Click on Figure 2 to enlarge it.)

parallelspace-modelmate-microsoft-detail

Figure 3. Microsoft Enterprise Visio Icons: View Detail
(same underlying ModelMate model)

Figure 3 is a similar view to Figure 2 but the Microsoft Enterprise Visio Stencil is used as the primary scheme. The pink color of the selected component denotes that it is an IP Subnet; the dark purple, an ArchiMate Network element. (Click on Figure 3 to enlarge it.)

parallelspace-modelmate-aws3d-detail

Figure 4. Amazon Web Services (AWS) 3D Icons: View Detail
(same underlying ModeMate model)

Figure 4 is virtually identical to Figure 3 except the AWS 3D set of icons is used as the primary scheme for rendering this view. (Click on Figure 4 to enlarge it.)

Each of these visualizations was rendering using the Linkurious graph visualizer running against a ModelMate model materialized in a Neo4j graph database.

Next Steps

More nirvana? Being able to see multiple schemes, side-by-side and interconnected at the same time rendered in a single view (e.g. ArchiMate for on-premise, AWS and/or Azure schemes used for the cloud, MS SharePoint stencil for the SharePoint information architecture, etc.). “More news at 11…”.

The Aperitif

Lastly and simply for your humor, I offer the following cartoon as the aperitif.

eamadeeasy

Figure 5. “Enterprise Architecture Made Easy”
Credit: Geek&Poke

Have IT Your Way.

Best regards,
Michael Herman (Toronto)
Parallelspace Corporation

mwherman@parallelspace.net

*ArchiMate is a registered trademark of The Open Group.

5 Comments

Filed under ArchiMate, Automated Application Architecture Analysis, Automated Enterprise Architecture Modeling, Crossing the EA Charm, Enterprise Architecture, ModelMate, Progressive Enterprise Architecture Map (PEAM)

ModelMate Architecture Reference Model

[Updated October 28, 2016]

This article describes the architecture reference model for deploying a comprehensive, integrated enterprise architecture modeling and data science platform based on ModelMate.

The audience for this article is IT professionals including enterprise architects, solution architects, and security architects who want increased visibility into the deployment of their custom applications, entire data center environments, business process definitions, and LOB applications such as SAP, Oracle Financials, Salesforce, Microsoft SharePoint, and Microsoft Dynamics CRM.

A primary use case is organizations with a requirement to move one or more on-premise applications or capabilities to the cloud or need a better understanding of how their hybrid on-premise/cloud environments (e.g. Salesforce cloud applications and on-premise or third-party customer loyalty solutions).

ModelMate

Quoting from Crossing the EA Chasm: Open Repository Strategies for Enterprise Architecture, “ModelMate is a working implementation of a Microsoft SQL Server and Neo4j graph database-based repository for managing arbitrarily large collections of arbitrary entities, properties, relationships, views, etc.to enable analysis, visualization, and understanding using easily-available open source and COTS (commercial off the shelf) business intelligence (BI), data visualization, and machine learning (ML) platforms, tools and cloud services.”

The primary goal of ModelMate is to provide automated support for the Continuous Transformation Framework of the Progressive Enterprise Architecture Model (PEAM) depicted in Figure 1.

progressive-ea-model-1-0-9-peam3-ea-chasm-auto-dots

Figure 1. Progressive Enterprise Architecture Model

Continuous Transformation Framework

The Continuous Transformation Framework is a Deming Cycle based on the following 4 phases:

  1. Listening & Learning
  2. Knowledge > New Designs
  3. Plan & Act
  4. Transformative Change > New Outcomes

The Framework is depicted as a continuous cycle as shown in Figure 1 above. The Framework can also be flattened and presented as a (repeating) sequence of 4 processes (Figure 2).

peam-continuous-transformation

Figure 2. Continuous Transformation Framework

Why all of this discussion about PEAM and the Continuous Transformation Framework? It is because to be able to understand and value the ModelMate Architecture Reference Model, it’s important to understand the class of problems it is trying to solve. Automated support for Continuous Transformation is the pain; ModelMate is the pain killer.

ModelMate Architecture Reference Model

There are 3 high-level layers in the ModelMate Architecture Reference Model:

  • Apps that use the ModelMate repository
  • Continuous Transformation Framework
  • ModelMate Open Hybrid Repository (MOHR)

These 3 layers (and 4 categories of apps) are illustrated in Figure 3.  Each app category corresponds to one phase in the Continuous Transformation Framework.

marm-modelmate-open-hybrid-repository-app-categories

Figure 3. ModelMate Architecture Reference Model: 3 Layers

The choice of apps that your organization selects for each category depends on the medium-term and long-term drivers and goals for your enterprise architecture program. The app groups map to specific phases of the Framework:

  1. Listen & Learn phase
    • Ingestion
  2. Knowledge > New Designs phase
    • Pure Modeling and Layout apps
    • Modeling, Layout & Visualization apps
    • Data Science apps
    • Custom Mobile and Web apps
  3. Plan & Act phase
    • Program & Project Management apps
  4. Transformative Change > New Outcomes phase
    • Operations and Change Management apps

Figure 4 lists a sample or representative list of applications that can fulfill the needs of each app category (each phase of the Continuous Transformation Framework).

marm-modelmate-open-hybrid-repository-apps

Figure 4. ModelMate Architecture Reference Model: Apps

Ingestion

Ingestion apps are responsible for scanning the enterprise’s operational environment: systems, assets, and processes. Information captured about each entity includes its structure, metadata, performance and usage data.  Operational business data is usually not needed and not captured.

Sources of data include business process logs, configuration management databases, LOB application configurations (SAP, SharePoint, Salesforce, Microsoft Dynamics CRM, Oracle Financials, etc.), operations management systems (Azure OMS, Microsoft System Center, etc.), Microsoft MAP Toolkit, performance monitoring logs, usage and audit logs, etc.

These are inbound data sources used to automatically update and maintain the EA models stored in ModelMate. Ingestion apps are the primary data sources for the Listen & Learn phase of the Continuous Transformation Framework.

Pure Modeling and Layout Apps

There are several types of apps that comprise the Knowledge > New Designs phase of the Framework.  Pure Modeling and Layout Apps are applications that support the manual modeling of entities, relationships, and metadata as well as the manual layout of stakeholder specific views.

The apps in the group do not support any built-in analysis and visualization capabilities beyond manually-created basic views. In addition, pure modeling and layout apps do not include an end-user scripting capability for performing automated, user-defined custom analysis or visualization.

Archi is an example of a pure modeling and layout app.

Modeling, Layout & Visualization Apps

These types of apps support manual modeling of entities, relationships and metadata and the manual layout of stakeholder specific views but also include basic, advanced, and/or custom analysis and visualization capabilities.

BiZZdesign Enterprise Studio and other advanced EA modelers are examples of apps that belong to the Modeling, Layout & Visual Apps group – supporting the needs of the Knowledge > New Designs phase of the Framework.

Data Science Apps

Data Science Apps include non-traditional “enterprise architecture” modeling and analysis apps. This group includes both open sources as well as COTS (commercial off the shelf) data science tools and platforms. Data Science apps provide advanced analysis, machine learning and visualization capabilities enabled through open access to enterprise architecture data via standard protocols and APIs (e.g.ArchiMate Exchange File Format, OData, SQL Server stored procedures, entity models, and advanced query and analysis languages such as R, Cypher, and T-SQL).

Examples of Data Science apps include: R Studio, Microsoft Power BI, Tableau, Domo, Linkurious, Microsoft Excel and the Neo4j graph browser.

Custom Mobile and Web Apps

This is the last group of apps that support the Knowledge > New Designs phase of the Framework and includes both no-code and code platforms for creating custom reporting, analysis, visualization apps.

No-code custom apps designed with Microsoft PowerApps (and Microsoft PowerFlow) are examples of the former; traditional C#/VB.Net, Java, and Node.js/JavaScript apps are examples of the latter.

Program & Project Management Apps

Program & Project Management Apps support the Plan & Act phase of the Framework.

Traditional portfolio, program, and project managements apps are examples of applications in this group. Collaboration tools such as Microsoft SharePoint, Confluence, and Jira can also belong in this group. Collaboration tools can also be considered as “horizontal” solutions that can be used across all phases of the Framework.

Operations and Change Management Apps

All of the effort to create and manage a functioning enterprise architecture solution only realizes direct business value when it leads to Transformative Changes being made in the enterprise’s strategies, systems, assets, and processes; and measurable, positive New Outcomes result from the changes.

Examples of apps in this category include change management applications that support IT Service Management (ITSM) disciplines such as ITIL. ServiceNow is an example of an ITSM app.

Please provide your feedback in the Comments section below or feel free to email me directly.

Best regards,
Michael Herman (Toronto)
Parallelspace Corporation
mwherman@parallelspace.net

*ArchiMate is a registered trademark of The Open Group.

All other trademarks, servicemarks, registered trademarks, and registered servicemarks are the property of their respective owners.

4 Comments

Filed under ArchiMate, Automated Application Architecture Analysis, Automated Enterprise Architecture Modeling, Business Value, continuous transformation, Crossing the EA Charm, Data Science, ModelMate, Power BI, Progressive Enterprise Architecture Map (PEAM), Salesforce, SharePoint

Crossing the EA Chasm: Automating Enterprise Architecture Modeling #1

If you have been following my Crossing the EA Chasm blog series (and related articles), you’ll have noticed a number of common themes:

Automating Enterprise Architecture Modeling

Automated enterprise architecture modeling (and automated application architecture analysis) are activities that belong to the Listening and Learning phase of the Continuous Transformation Framework.

Progressive EA Model 1-0-9-PEAM3-EA Chasm-Auto-Dots.png

Figure 1. Progressive Enterprise Architecture Model: Continuous Transformation Framework

Supporting the above themes, the Technology layer diagram below is automatically generated from a simple, single line query applied to an automatically created and dynamically maintained model of 500+ Windows and Linux servers (blue dots) with 550+ server network adapter configurations (yellow dots) connected to 25 network gateways (blue dots representing 25 network routers/switches). The data originates from a series of tables maintained by a configuration management database (CMDB) solution. There is no way to understand what the Technology environment looks like by simply looking at these tables.  However, in the visualization below, it is easy to see that there are at least 14 different server farms, application clusters, and data centers.

Parallelspace TEAM-DevicesA.png

Figure 2. Automatically Generated Technology Layer Model and View

In this ModelMate model, servers are represented by Nodes with 179 properties;  network adapter configurations as Devices with 69 properties each; and, network gateways as Devices with 4 properties per device.

This is just the beginning as additional information about web application, database, DNS, and directory and domain management services is used to add additional  detail to the current state Technology layer of this enterprise architecture. “More news at 11…” (click here).

This effort was made easier through the use of ModelMate and the Neo4j Community Edition free, open source graph database and the Cypher query language.

Best regards,

Michael Herman (Toronto)

Parallelspace Corporation

mwherman@parallelspace.net

4 Comments

Filed under ArchiMate, Architecture Reference Models, Automated Application Architecture Analysis, Automated Enterprise Architecture Modeling, Crossing the EA Charm, Data Science, Enterprise Architecture, ModelMate, Progressive Enterprise Architecture Map (PEAM), The Open Group

#Graphitization of .NET Applications: Marrying Open EA Data with Graph Databases

[Updated October 20, 2016]

As I’ve worked to support open access to enterprise architecture data by creating the ModelMate project, the range and diversity of how enterprise data can be analyzed and visualized has proved to be amazing.  Here’s yet another example: the marrying of open EA data in ModelMate models with a graph database platform …in less than 1 day.

The native (schema-less) representation for a graph database mirrors the ArchiMate* metamodel one-for-one:

  • Entities that support named types (“labels”)
  • Relationships between directed pairs of entities that also support named types (“relationship types”)
  • Unlimited property sets per entity
  • Unlimited property sets per relationship

Add to this, powerful query capabilities, a small footprint, and hyper-scalability. For example, being able to find all of the ArchiMate concepts that are 1, 2, 3, or an infinite number of relationships away from each of the Application Components in a large model and have these queries run and visualize in milliseconds (see the examples below).

For ModelMate’s first graph database integration, Neo4j from Neo Technologies was used. It was simple and efficient to install and was useable within a few minutes.  After working most of the morning to learn the Cypher query language to integrate and query the ModelMate data, the afternoon was spent exploring the graph model and experimenting with a range of queries. The most recent ModelMate logical architecture looks like the following (October 19, 2016).

modelmategraphdbhighlighted

Figure 1. ModelMate Logical Architecture

Automated Application Architecture Analysis

What are some of the results?  Here’s a series of views created with simple, single-line queries against the ModelMate graph. The scenario is automated application architecture analysis to support migration of on-premise applications to the cloud.

This version of the VetContext ModelMate model used for this example included:

  • 8714 elements (nodes) – files, assemblies, modules, methods, fields, method calls, and field references represented as ArchiMate application and technology layer concepts
  • 16,210 relationships – modeled as ArchiMate relationships that linked the above elements into a ModelMate graph

TIP: If you click on each image, you can check out the single line query at the top of each screenshot.

vetcontexta

Figure 2. Application Architecture: Contains and References Relations (1 hop)

vetcontextb

Figure 3. Application Architecture: Contains, Defines, and References Relations (2 hops)

vetcontextd

Figure 4. Application Architecture: Accesses, Calls, Contains, Defines, References, References and Type For Relations (3 hops)

vetcontextz

Figure 5. Application Architecture: Visualize Relations between all Application Components, Artifacts, and System Software Components (any number of hops)

vetcontexte

Figure 6. VetContext ModelMate Graph: All Application Components (any number of hops)

In Figure 7 below you can see the much smaller VetContext application in the green circle in contrast with all of the public classes and methods found in the Entity Framework assembly from Microsoft (blue circle).

VetContextEFHighlighted.png

Figure 7. VetContext Application References into the Microsoft Entity Framework

Impressive for 1-day’s worth of effort (including training).

Best regards,
Michael Herman (Toronto)
Parallelspace Corporation

Mail: mwherman@parallelspace.net

p.s. What is the VetContext ModelMate model that I’m using for these blog postings?

The VetContext ModelMate model is based on the Microsoft Entity Framework sample of the same name from the book Programming Entity Framework: Code First by Julia Lerman and Rowan Miller. The ModelMate model is comprised of data from all of the .NET assemblies, modules, type definitions (including classes, enums, etc.), method definitions, field definitions, method calls and field accesses as well as the physical files that store the assemblies in the VetContext sample application. A simplified VetContext class diagram (from Visual Studio) appears below.

vetcontextclasshierarchy

Figure 8. VetContext Class Diagram

The ModelMate Scanner for .NET Application Migration reads a folder of all of the .exe and .dll files for one or more .NET applications and builds the ModelMate model. No source code is needed. The scanner reads and parses the intermediate language (MSIL) directly.

p.p.s. The original ModelMate SQL Server schema (the original data source for the ModelMate graph) looks similar to the following. This was used before ModelMate included support for graph databases.

modelmateschema-views

Figure 9. ModelMate SQL Server (non-graph database) Schema
(obsoleted by the ModelMate migration to Neo4j graph database)

 * ArchiMate is a registered trademark of The Open Group.

3 Comments

Filed under ArchiMate, Automated Application Architecture Analysis, Crossing the EA Charm, Data Science, Enterprise Architecture, Graphitization, Progressive Enterprise Architecture Map (PEAM), The Open Group

Crossing the EA Chasm: “Where does IoT [Internet of Things] fit in?”

In the article The EA Chasm: Open Repository Strategies for Enterprise Architecture, Vijay Sharma asked the question: “Where does IoT [Internet of Things] fit in?”. Vijay, you couldn’t have chosen a more perfect example or a better question.

The one-word answer is “everywhere” – no sarcasm intended.

The “1000 word” answer can be found in the following diagram based on the Progressive Enterprise Architect Map (PEAM) model (click to enlarge):

Progressive EA Model 1-0-7-PEAMS-Chasms-IoT.png

The first thing that strikes me about this diagram is: with the need to complete 15+ major, cross-functional, interdependent activities, it is completely understandable why major digital business initiatives fail or, otherwise, “wither and die on the vine” before they’re completed.  This applies to all digital business initiatives – not just IoT.

Second, what happens when an IoT (or any other enterprise) initiative starts off as a “skunkworks” project?  Placing the question in the context of the above diagram, what if IoT starts off on the far, far right (activities 12-15) as unplanned, uncoordinated activities by a group without any defined business drivers, linkage to the business strategy, or connection to the enterprise architecture?

Food for thought (and time for breakfast).

Best regards,
Michael Herman (Toronto)
Parallelspace Corporation

p.s. Why was activity 16 (IoT Platforms and Tools) placed inside the Enterprise Architecture Chasm?

It’s mostly unrelated to the above discussion but it hints at the idea that IoT approaches can also be used in a non-traditional way to Listen to signals in the  Enterprise Assets, Systems, and Processes (performance data, usage information, planned and unplanned changes in the operational processes and systems, etc.), and then use this data to annotate the Core Enterprise Architecture. BI techniques can be used to analyse and visualize the annotated EA model to create new Designs.  The coordination of the building and  deployment of the new Designs hopefully results in Transformative Changes being applied to the Enterprise’s Strategies, Systems, Assets, and Processes to produce additional, meaningful business value.

IoT Platforms and Tools are enablers for listening and responding to the “hum” of an organization’s systems, assets and processes, and, when fully realized, can also be used to distribute Transformative Changes in a software-defined enterprise.

To read more about using IoT to create, maintain and manage an enterprise architecture, check out External IoT vs. Internal IoT: Beware of the Hype Cycle.

1 Comment

Filed under ArchiMate, Architecture Reference Models, Crossing the EA Charm, Enterprise Architecture, ModelMate, Progressive Enterprise Architecture Map (PEAM)

Progressive​ Enterprise Architecture Maps – Update 2

Pavel Harbe asked an interesting question with respect to the original version of the Progressive Enterprise Architecture Map: “Why … is Strategy first and then Motivation and not in opposite order (or in many iterations)?” and goes on to explain that, yes, in fact Motivation should precede Strategy (at least initially, and then followed by possibly several iterations).  Of course, Pavel is correct …but so is the diagram (see below). However, Pavel’s comments do indicate a need to clarify these points – here in text as well as in a new version of the Progressive Enterprise Architecture Map.

Progressive EA Model 1-0-3-NoArrows-Slide

*Original discussion: Progressive Enterprise Architecture Maps

To respond directly to Pavel’s question, the subtlety in the original diagram can be found in text beneath the caption of each layer (emphasis added for this explanation):

  • Strategy refers to the “Strategy of the *Enterprise*”, the organizational strategy.
  • Motivation refers to the “Intentions of the *Architecture*”, a phrase borrowed from Gerben Wierda’s original discussion (An ArchiMate 3 Map (Layers? What Layers!))

The original diagram referred to the strategy of the organization driving the motivations [intentions] for the companion enterprise architecture.

Given pragmatic usefulness is one of my goals for the Progressive Enterprise Architecture Map (while at the same time preserving architectural simplicity), the following elaboration is warranted: adding 2 more layers to clarify the levels at which Strategy and Motivation are used to drive continuous transformation of the organization and its enterprise architecture.  Here is version 2 of Progressive Enterprise Architecture Map.

Progressive EA Model 1-0-3-PEAM2-Slide

On the left side of the diagram, there is a distinct pair of Motivation and Strategy layers for enterprise-level strategy planning.  In addition, there is a distinct pair of these 2 layers which transform the enterprise-level drivers, goals, and strategies into drivers, goals, and strategies for the enterprise architecture. You can argue these should be the same but due to many reasons such as timing and resources, they are not always the same.

Progressive Enterprise Architecture Maps, Continuous Transformation, and Total Enterprise Architecture Managment

Given this elaboration, I decided to “take it all the way” and link Progressive Enterprise Architecture Maps to Continuous Transformation and Total Enterprise Architecture Managment – topics I’ve discussed and modeled in the article [Enterprise Architecture] Tools and Methods Don’t Create Business Value.  The model for Continuous Transformation and Total Enterprise Architecture Managment looks like the following:

Parallelspace-Business Value from Transformative Change4

Here’s version 3 of the Progressive Enterprise Architecture Map (linked to Continuous Transformation and Total Enterprise Architecture Management).

Progressive EA Model 1-0-3-PEAM3-Slide

Best regards,
Michael Herman (Toronto)

1 Comment

Filed under ArchiMate, Architecture Reference Models, Enterprise Architecture, Progressive Enterprise Architecture Map (PEAM)