Category Archives: Data Science

Tokenize Every Little Thing (ELT)

[Since first writing this article in January 2018, I’ve concluded that Ethereum is not capable of being a platform for Tokenizing Every Little Thing. Ethereum is a one-trick pony x 1500 when it comes to creating large-scale decentralized applications (i.e. Ethereum/Solidity smart contracts are best for creating single, simple entities like alt-coins). Checkout slide 56 of this presentation: NEO Blockchain Vancouver 20180315 Meetup. The NEO Blockchain and NEO Smart Economy is the best available 3rd generation distributed application platform on the planet and improving every day. Michael Herman, March 17, 2018]

[Also checkout the webcast The NEO Smart Economy, Smart Processes, and Smart Data. Michael Herman, April 9, 2018]


Just over one year ago, I introduced the concept of graphitization and talked about #Graphitization of the Enterprise. I opened the article with the challenge:

Move beyond digitalization of the enterprise to graphitization of the enterprise.

For 2018 and beyond, the challenge is simpler but more difficult:

Tokenize Every Little Thing (ELT)

To provide more context, let me first quote from the introductory paragraphs of the #Graphitization article.

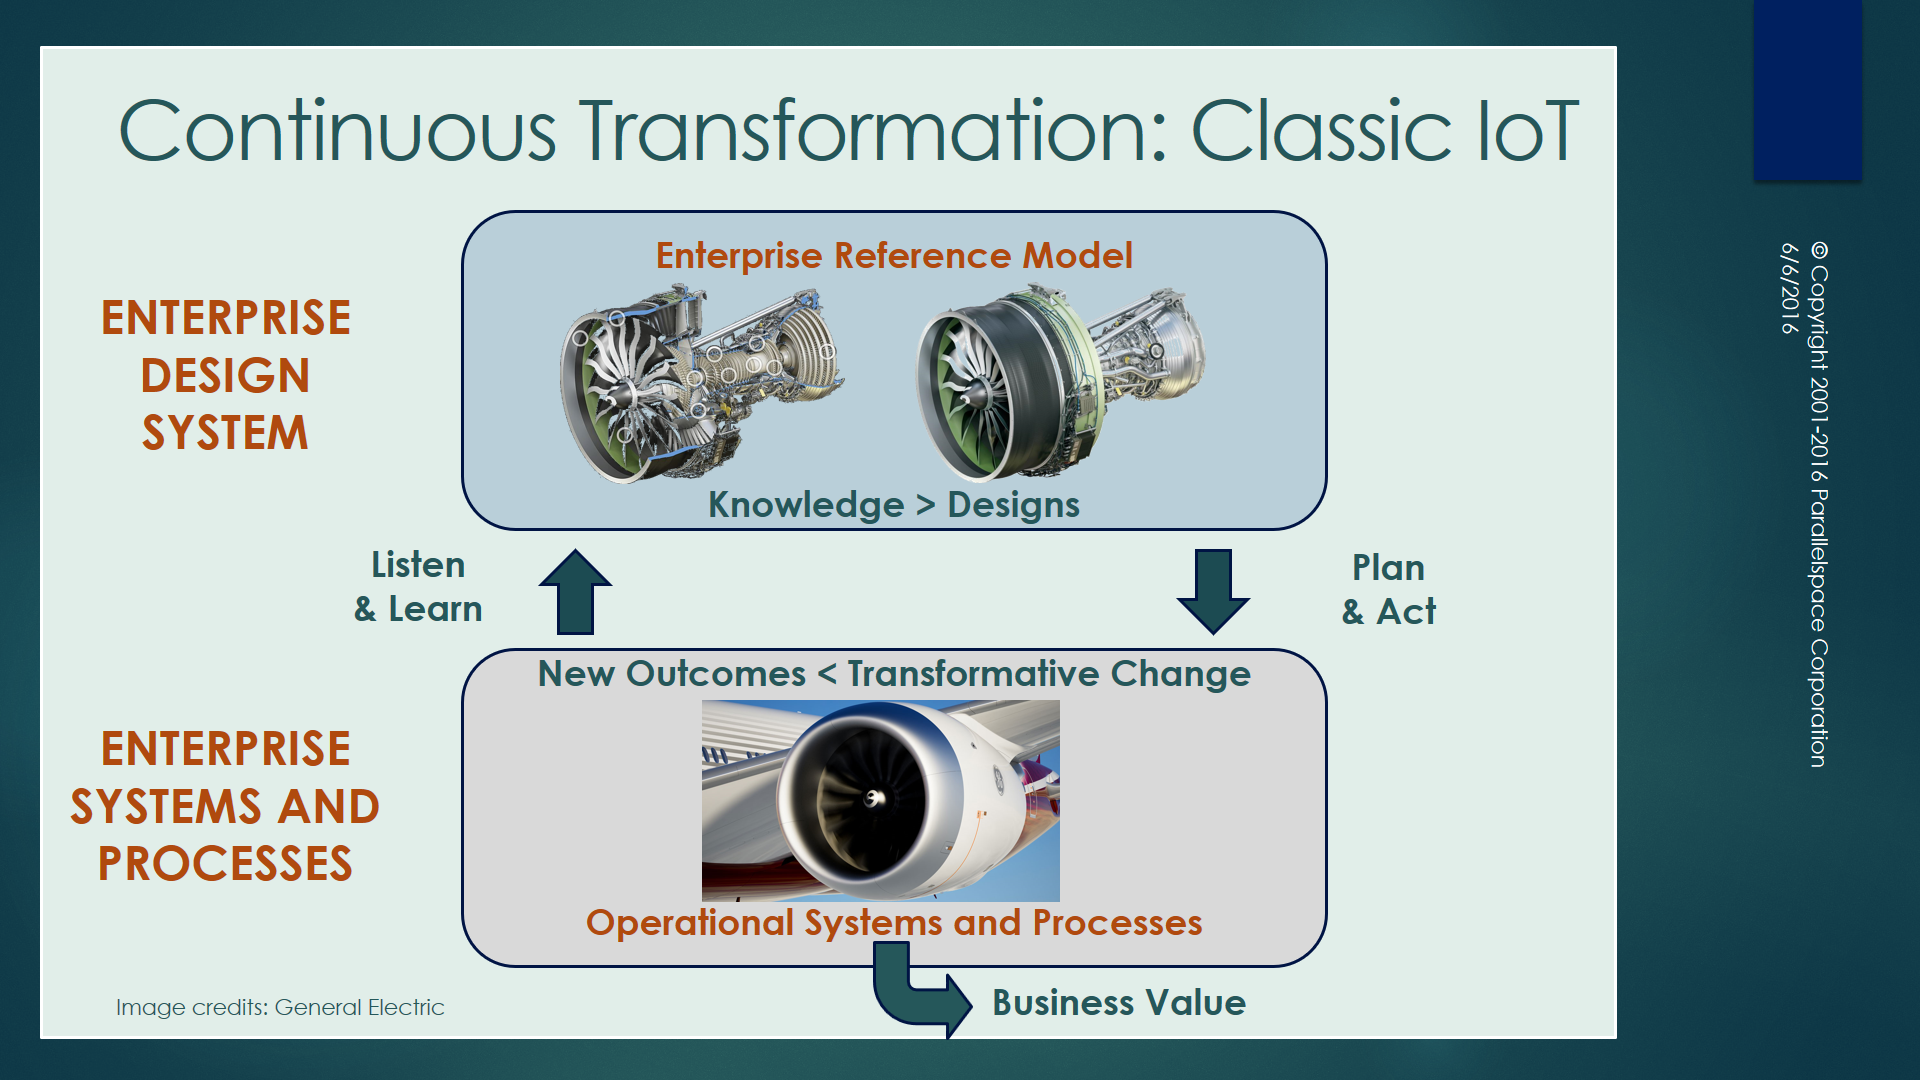
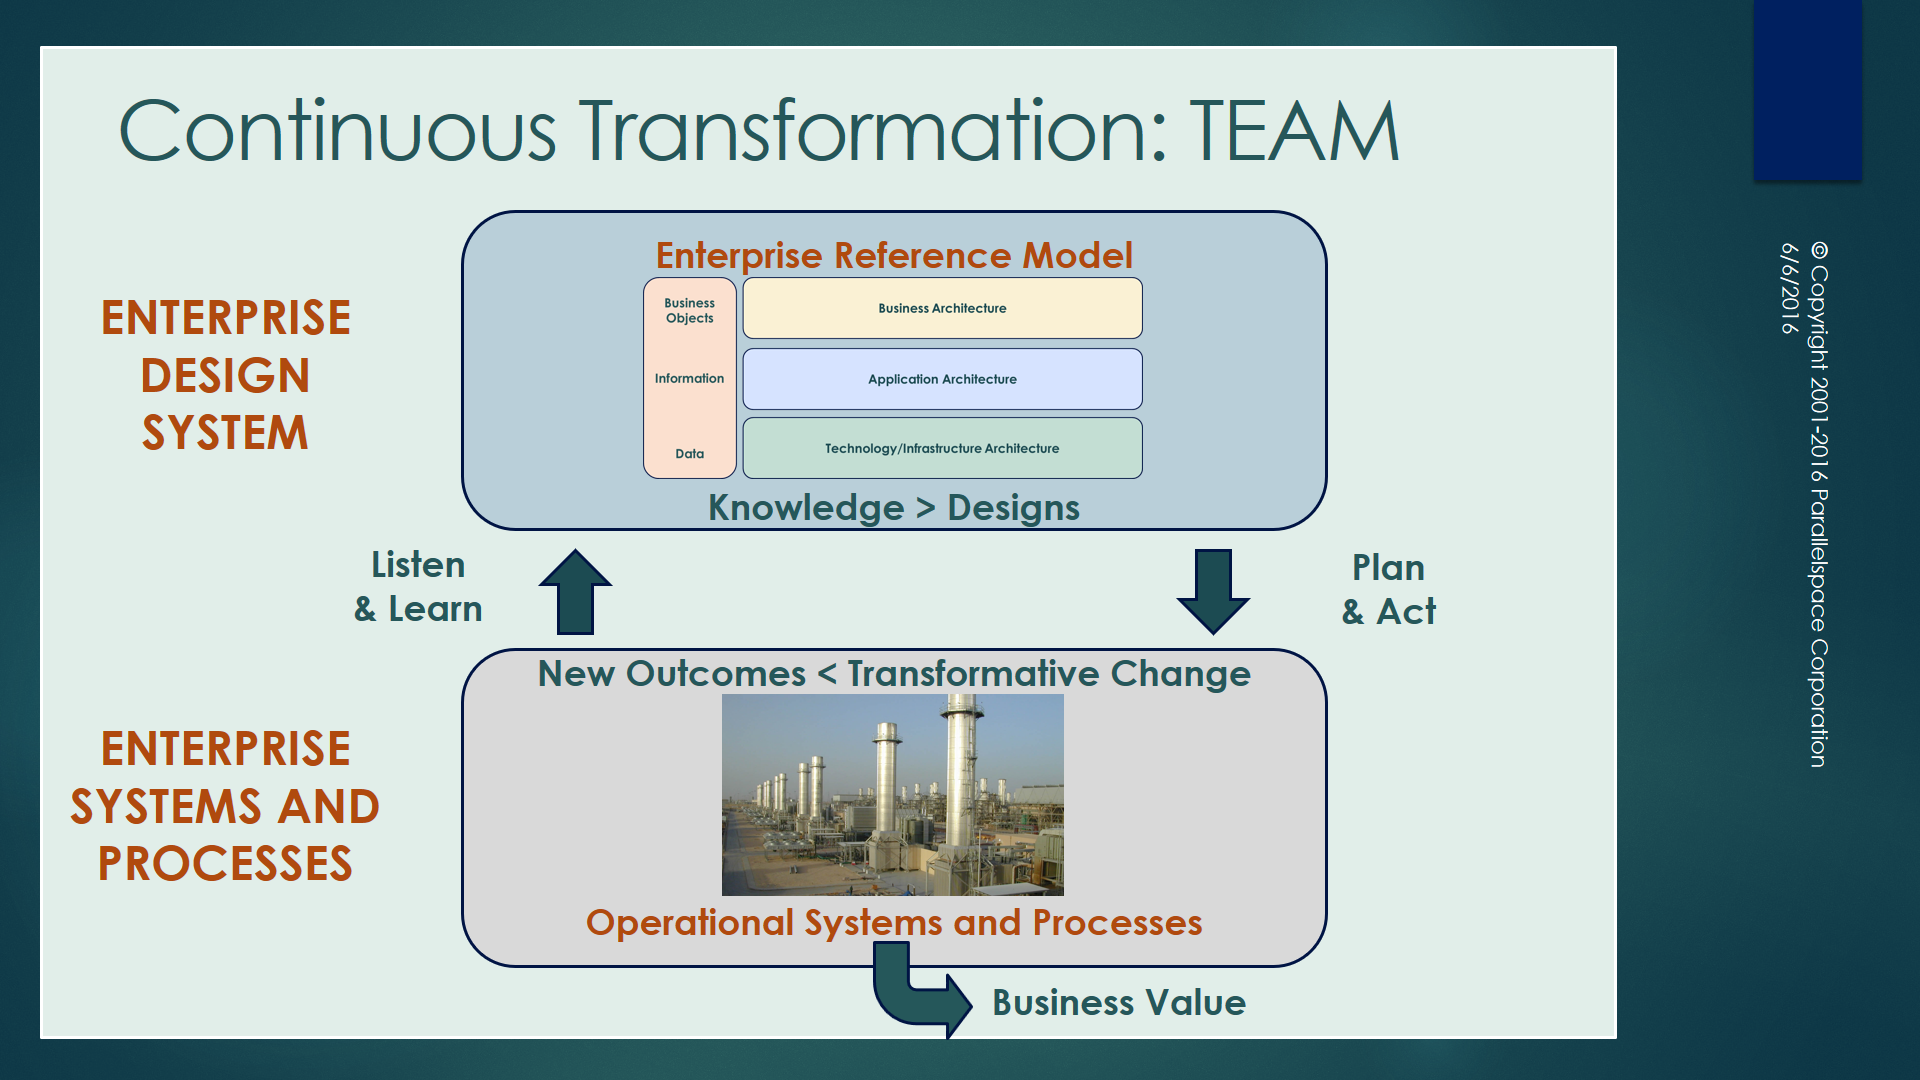
Here’s a great diagram that explains this concept [graphitization]. (click on the diagram to enlarge it)

graphitization-new-world-of-it
Figure 1. The New Model of IT

Graphitization of not only all of your corporate information assets across all of your constituencies and stakeholders – at the data, application entity, and business object level – but also the graphitization of all of the interconnections between every business process, application system, infrastructure component, cloud service, vendor/service provider, and business role that uses, manages, or stores corporate information (Crossing the EA Chasm: Automating Enterprise Architecture Modeling #2).

Use graphitization to make your existing corporate information more available, more usable, and more informative. Graphitization enables you to “Keep Calm and Have IT Your Way“.

What is #Graphitization?

#Graphitization is a data science and enterprise architecture-inspired framework and process model for modeling, ingesting, organizing, analyzing, and visualizing any domain of endeavor by using graphs – networks of connected objects and relationships with each object and relationship annotated with additional descriptive information (metadata).

Why #Tokenization?

Given the burgeoning preoccupation of the world’s business, finance, government, and technology sectors with blockchain technologies, cryptocurrencies, and token-this and token-that, the buzzword for 2018 will be #Tokenization …the creation of tokens (multiple versions of tokens) to represent every thing on the planet …Every Little Thing (ELT).

While individuals, startups and larger organizations are trying to dream up the next big, one-off, token or crytocurrency, why not just admit that, “in the end”, everything will be represented by a token?

Why try to knock these off one at a time (e.g. Bitcoins, Ethers, altcoins, CryptoKitties, letters of credit, auctions, escrow agreements, electronic health records (EHR), electronic medical records (EMR), etc.) when the ultimate goal to to create a universal interconnected graph of ELT (Every Little Thing) in the universe?

Why #graphitize the enterprise when you can #tokenize the universe?

What is #Tokenization?

Let’s get a little computer-sciency for just a minute. A common task to to take an input stream (a string of characters, a stream of data, a data file or database table), analysis it, and convert it into a collection or sequence of higher-level tokens for further analysis (a process that can be applied recursively). Here’s an explanation from Wikipedia

In computer science, lexical analysis, lexing or tokenization is the process of converting a sequence of characters (such as in a computer program or web page) into a sequence of tokens (strings with an assigned and thus identified meaning). A program that performs lexical analysis may be termed a lexer, tokenizer, or scanner… [https://en.wikipedia.org/wiki/Lexical_analysis]

…and later in the same Wikipedia article…

Tokenization

Tokenization is the process of demarcating and possibly classifying sections of a string of input characters. The resulting tokens are then passed on to some other form of processing. [https://en.wikipedia.org/wiki/Lexical_analysis#Tokenization]

Coming up for air… Why not represent ELT that happens in the universe as a stream of blockchain transactions?

  • the events in your life?
  • everything that occurs during a Presidential election?
  • the 24-hour cycle of one day changing into the next?
  • the activity-by-activity and task-by-task execution of a business process?
  • a stream of events from your Internet-of-Things (IoT) enabled car, toaster or refrigerator?

Jim Gray and TerraServer

In one of his several presentations on Scalable Computing (circa 1999), Jim Gray (relational database pioneer and Turing Award winner) describes the TerraServer project in the following way:

[Users navigate] an ‘almost seamless’ image of earth.

SkyServer was a similar project quarterbacked by Gray:

TerraServer allowed access to newly-available satellite imagery with resolution of 1.5 meters/pixel. SkyServer, a collaboration with Alexander Szalay and his colleagues at Johns Hopkins, allowed access to astronomical data from the Sloan Digital Sky Survey. SkyServer led to additional work with astronomical data, … [https://amturing.acm.org/award_winners/gray_3649936.cfm]

Tokenize Every Little Thing

With the advent of blockchain technologies (in particular, the Ethereum extensible blockchain platform), why can’t we embark on a grander mission to tokenize Every Little Thing? …and including all token-pair relationships (TPRs).

What will it take?

What needs to change in the Ethereum blockchain platform? Will Ethereum be able to scale to support modeling, ingesting, organizing, analyzing, and visualizing of Every Little Thing (ELT)?

On your mark, get set, …

Best regards,
Michael Herman (Toronto)

mwherman@parallelspace.net

Other Important References

  • Gordon Bell, MyLifeBits MSR Project (early 2000’s). I remember Jim Gray telling this story but I had trouble finding a proper reference because I thought it was Gray’s story instead of Bell’s.  I now know better but I’ve already finished the above article. A Wikipedia MyLifeBits reference can be found here. YouTube videos can be found here, here, and others over here. Channel 9 videos: Part 1 and Part 2. Computerworld article (2008). Business Inside article (2016).
  • Gordon Bell’s MSR web page.
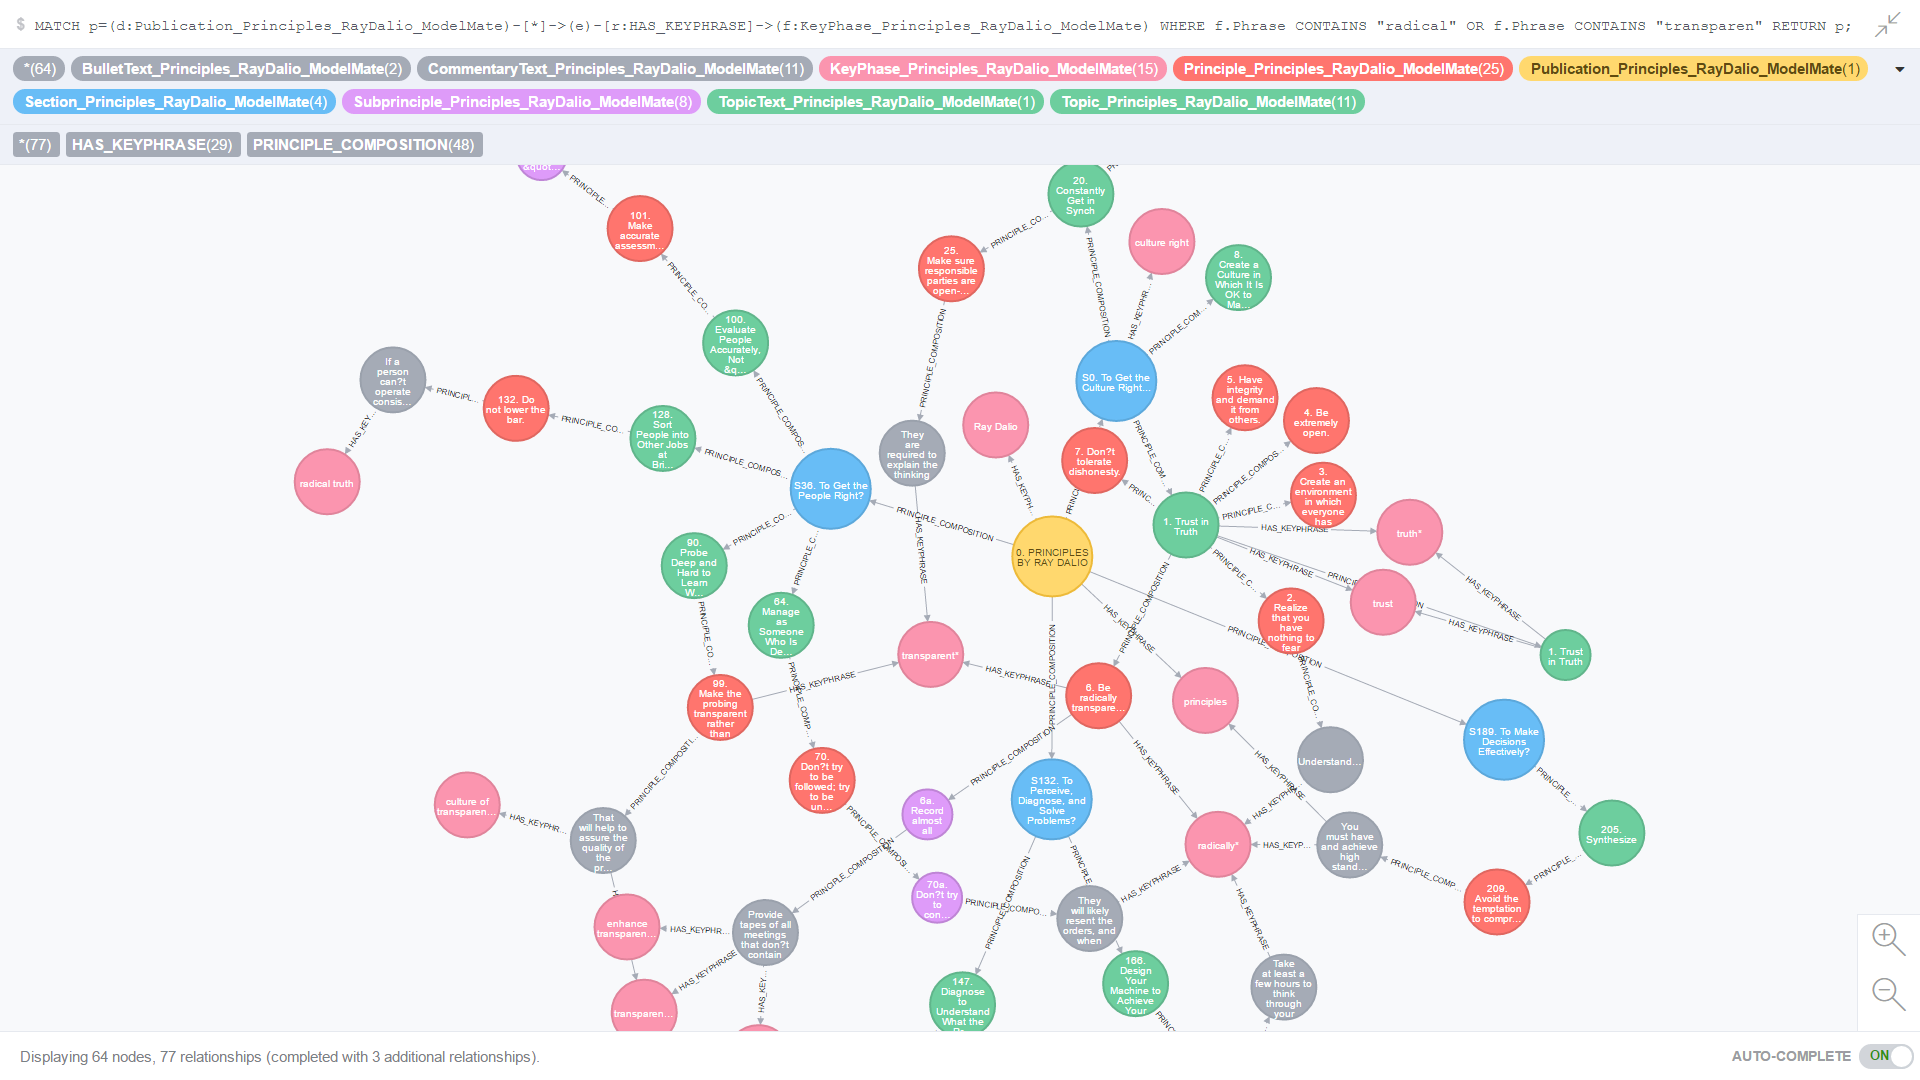
 

3 Comments

Filed under Architecture Reference Models, blockchain, Business Value, Data Science, Enterprise Architecture, Ethereum, Every Little Thing, graph database, Graphitization, How do we think, Nethereum

What are the differences between improving the design (and operation) of a smart city, an aircraft engine, a muscle car, a large enterprise, and/or an integrated commercial global cloud services platform …all running at hyperscale?

COPYRIGHT © 2016-2017 by Michael Herman, Toronto, Canada. All rights reserved. [Updated June 16, 2018]

Question: What are the differences between improving the design (and operation) of:

  • a smart city,
  • an aircraft engine,
  • a muscle car,
  • a large enterprise, and/or
  • an integrated commercial global cloud services platform
  • …all running at hyperscale?

Answer: None.

Scroll down to see the use cases; then the list of resources at the bottom of this article.

Use Case 1: Aircraft engine, and
Use Case 2: 
Muscle car

Continuous Transformation 2

Figure 1. Continuous Transformation Model: Aircraft Engines and Muscle Cars

Use Case 3: Smart city,
Use Case 4: Large enterprise operating at hyperscale, and
Use Case 5: 
Integrated commercial global cloud services platform operating at hyperscale

Continuous Transformation 1.png

Figure 2. Continuous Transformation Model: Smart Cities, Large Enterprises, and Cloud Services Platforms

Diving Deeper: #Graphitization

To go deeper, checkout #Graphitization of the Enterprise (click here) as well as the list of references below.

progressive-ea-model-1-0-9-peam3-ea-chasm-auto-dots

Figure 3. #Graphitization Continuous Transformation Model


progressive-ea-model-1-0-11-peam5-1010

Figure 4. Continuous Transformation Framework: Process Groups and Activities

References

  1. Michael Herman, Blockchain Developer, Enterprise Architect and Data Scientist: #Graphitization Inventor  (click here)
  2. Continuous Transformation and Transformative Change are key principles of the Total Enterprise Architecture Model (TEAM) (click here)
  3. To dig deeper, check out Graphitization of the Enterprise (click here)
  4. [Enterprise Architecture, Big Data, CRM, ERP, …] Tools and Methods Don’t Generate Business Value (click here)

Best regards,

Michael Herman
Enterprise Architect and Data Scientist
Parallelspace Corporation
M: 416 524-7702
E: mwherman@parallelspace.net
B: http://hyperonomy.com
L: https://www.linkedin.com/in/mwherman/recent-activity/posts/
Skype: mwherman2000

Living at the intersection of Enterprise Architecture, Enterprise Knowledge, and Data Science

1 Comment

Filed under ArchiMate, Architecture Reference Models, Crossing the EA Charm, Data Science, Enterprise Architecture, Graphitization, How do we think, IoT, Space Flight

#Graphitization of the Enterprise

COPYRIGHT © 2016-2017 by Michael Herman, Toronto Canada. All rights reserved. [Updated June 16, 2018]

This article is the first in a series on #Graphitization. Click here to explore the other articles in this series.

Reprinted from #Graphitization of the Enterprise on LinkedIn.

Move beyond digitalization of the enterprise to graphitization of the enterprise. Here’s a great diagram that explains this concept. (click on the diagram to enlarge it)

graphitization-new-world-of-it
Figure 1. The New Model of IT

Graphitization of not only all of your corporate information assets across all of your constituencies and stakeholders – at the data, application entity, and business object level – but also the graphitization of all of the interconnections between every business process, application system, infrastructure component, cloud service, vendor/service provider, and business role that uses, manages, or stores corporate information (Crossing the EA Chasm: Automating Enterprise Architecture Modeling #2).

Use graphitization to make your existing corporate information more available, more usable, and more informative. Graphitization enables you to “Keep Calm and Have IT Your Way“.

What is #Graphitization?

#Graphitization is a data science and enterprise architecture-inspired framework and process model for modeling, ingesting, organizing, analyzing, and visualizing any domain of endeavor by using graphs – networks of connected objects and relationships with each object and relationship annotated with additional descriptive information (metadata).

The primary applications of #Graphitization are:

  • System optimization,
  • Systems life cycle management, and
  • Transformative Change in resulting in positive increases in business value for the system being studied.

A system is defined as any collection of strategies, system components, assets, architectures or processes.

Using #Graphitization

Use graphitization of your organization to help close both the Enterprise Architecture Chasm and the Operational Data Chasm. See below.

progressive-ea-model-1-0-11-peam4-operational-data-chasm
Figure 2. Continuous Transformation Framework: Enterprise Architecture Chasm and Operational Data Chasm

progressive-ea-model-1-0-11-peam5-1010
Figure 3. Continuous Transformation Framework: Process Groups and Activities

To learn more about other applications of graphitization, check out the following articles:

Best regards and best wishes for the New Year,

Michael Herman (Toronto)
Parallelspace Corporation
mwherman@parallelspace.net

6 Comments

Filed under continuous transformation, Crossing the EA Charm, Data Science, Digital Transformation, Enterprise Architecture, Enterprise Architecture Chasm, Graphitization, ModelMate, Operational Data Chasm, Progressive Enterprise Architecture Map (PEAM)

#Graphitization of Ray Dalio’s Principles: Iteration 2

COPYRIGHT © 2016-2017 by Michael Herman, Toronto Canada. All rights reserved.

This article is the third in a series on #Graphitization. Click here to explore the other articles in this series.

Iteration 2 is a small iteration that had a goal of improved key phrase-based exploration and visualization of The Principles of Ray Dalio.  This iteration builds on the ModelMate model of The Principles described earlier in this series: #Graphitization of Ray Dalio’s Principles: Iteration 1 and represents a significant improvement in terms of understanding which principles are realized by specific combinations of key phases.

Iteration 2 uses the same query used in Iteration 1. This time, the Linkurious graph visualization app is used to display the subgraph of all Topics, Principles, Subprinciples, Commentary, Questions, etc. directly or indirectly related to the key phrases “radically” and “transparent”. This concept is represented by the following simple query:

MATCH path =
 (pub:Publication_Principles_RayDalio_ModelMate)-[*]->(principle)
 -[r:HAS_KEYPHRASE]->(phrase:KeyPhase_Principles_RayDalio_ModelMate)
 WHERE phrase.Phrase CONTAINS "radical"
 OR phrase.Phrase CONTAINS "transparen"
 RETURN path;

The Principles subgraph containing all elements that are directly or indirectly related to the key phrases “radically” and “transparent” is shown below (click to enlarge).

ModelMate-Ray-Dalio-Radically Transparent.png

Figure 1. All Topics, Principles, Subprinciples, etc. with Traceability to the Key Phases “radically” and “transparent”

The underlying graph is implemented using the ModelMate framework and implemented using the Neo4j graph database.

Best regards,

Michael Herman (Toronto)
Parallelspace Corporation
mwherman@parallelspace.net

7 Comments

Filed under Automated Enterprise Architecture Modeling, continuous transformation, Data Science, Graphitization, How do we think, ModelMate, Progressive Enterprise Architecture Map (PEAM)

#Graphitization of Ray Dalio’s Principles: Iteration 1

COPYRIGHT © 2016-2017 by Michael Herman, Toronto Canada. All rights reserved.

[If you “only want to see the pictures”, scroll down to Figure 4.]

This article is the second in a series on #Graphitization. Click here to explore the other articles in this series.

Background

ray-dalioRay Dalio is Chairman & Chief Investment Officer at Bridgewater Associates, L.P., the world’s largest hedge fund, and is well known for The Principles that he and his colleagues at Bridgewater use to govern themselves and each other. Mr. Dalio has published the 200+ Principles in a 123-page document and made the content publically available on a dedicated website: Principles by Ray Dalio (“The Principles”). Here is his description of The Principles…

“What is written here is just my understanding of what it takes: my most fundamental life principles, my approach to getting what I want, and my “management principles,” which are based on those foundations. Taken together, these principles are meant to paint a picture of a process for the systematic pursuit of truth and excellence and for the rewards that accompany this pursuit. I put them in writing for people to consider in order to help Bridgewater and the people I care about most.”

I encourage you to read more of his Introduction here.

What is #Graphitization?

#Graphitization is a data science and enterprise architecture framework and process model for modeling, ingesting, organizing, analyzing, and visualizing any domain of endeavor by using graphs – networks of connected objects and relationships with each object and relationship annotated with additional descriptive information (metadata).

The primary applications of #Graphitization are:

  • System optimization,
  • Systems life cycle management, and
  • Transformative Change in resulting in positive increases in business value for the system being studied.

A system is defined as any collection of strategies, system components, assets, architectures or processes.

In the article #Graphitization of the Enterprise, I’ve provided a number of illustrations of how one field of endeavor, the continuous transformation of large enterprise organizations, can benefit from #Graphitization. My blog contains several additional examples of #Graphitization applied to traditional enterprise architecture; for example, Crossing the EA Chasm: Automating Enterprise Architecture Modeling #2.

Why not try applying #Graphitization to something completely different?

#Graphitization of Ray Dalio’s Principles

A few weeks ago (December 22, 2016), the Wall Street Journal published an article (The World’s Largest Hedge Fund Is Building an Algorithmic Model From its Employees’ Brains) which describes Mr. Dalio’s vision for creating “The Book of the Future.”

“One employee familiar with the project described it as “like trying to make Ray’s brain into a computer.””

2 + 2 = ?  You guessed it. Why not try to graphitize part of Mr. Dalio’s brain?

That is, why not try to turn The Principles into a computer model that documents each Principle, its hierarchical inter-relationships, and, via some sophisticated cloud-based text analysis services, visualize all of the important interconnections based on a set of computer-chosen key phrases?

This article documents Iteration 1 of the #Graphitization of Ray Dalio’s Principles.

Wisdom in, Wisdom out

Today, there are several easy-to-use technologies that enable developers to view web pages as sophisticated databases.  The Principles website (a single web page) is no exception.

A simple query like the one below makes it is easy to exact the hierarchy of Sections, Topics, Principles, Subprinciples, Summary Paragraphs, Questions, Bullets, Figures, etc. from The Principles using a single statement.

modelmate-ray-dalio-html-query

Figure 1. The Principles Web Page Query

A sample portion of The Principles web page appears below and has the following structure:

  • “To Get The Culture Right…” is a Section. There are 4 Sections at the top level of the Publication.
  • “TRUST IN TRUTH” is a Topic and it is also a numbered Principle.
  • “Realize that you have nothing to fear from truth.” is a numbered Principle.
  • Principles can contain numbered Subprinciples.
  • Topics, Principles, and Subprinciples can have (unnumbered) Summary Paragraphs, Questions, Bullets, Figures, etc.

Topics, Principles, and Subprinciples are numbered sequentially; there is no hierarchical numbering scheme.

Ray-Dalio-Principles-radically-transparent-web.png

Figure 2. Web Page Sample: The Principles By Ray Dalio

In my ModelMate model for The Principles, 3 classes of key phrases are used to cross-index each Topic, Principle, Subprinciple, etc.

  1. Key Topics – short phrases deemed to be particularly relevant and interesting across the entire document (i.e. the corpus)
  2. Key Phrases – short phrases deemed to be of particular importance within the scope of a single title, paragraph of text, question, or bullet.
  3. Other Phrases – additional key phrases chosen because they are particularly relevant to Bridgewater, Mr. Dalio, and The Principles.

In total, there are 2470 key phases; about 200 of these are Key Topics selected by a cloud-based text analytics service, about 300 are Other Phases. The remaining Key Phrases (with a few overlaps) were selected by a different text analytics service that was run against the text of each individual Topic, Principle, Subprinciple, etc.

A sample of the ingested The Principles web page content looks like the following (click to enlarge):

exampledata-keyphrases

Figure 3. Ingested Web Page

Results of Iteration 1

The entire structure and content of The Principles was ingested during Iteration 1 of this project:

  • 210 principles comprised of 768 artifacts (titles, paragraphs, questions, bullets, …)
  • 767 structural relationships
  • 2470 key phrases
  • 6126 key phrase-principle semantic relationships

The sample queries below highlight The Principles that are related to 2 critically important concepts at Bridgewater: “radically” and “transparent” (including all words that have these words as reasonable root words).

The single line queries found all artifacts that were in some way related to the 2 key phases; then calculated the traceability up to through to the top (beginning) of The Principles (click to enlarge).

ray-dalio-principles-radically-transparent

Figure 4. All Topics, Principles, Subprinciples, etc. with Traceability to the Key Phases “radically” and “transparent”

The large orange dot represents the top (the root of the web page). The large blue dots represent the 4 top-level Sections in The Principles:

  • To Get the Culture Right…
  • To Get the People Right…
  • To Perceive, Diagnose, and Solve Problems…
  • To Make Decisions Effectively…

The green dots are Topics; the red dots are Principles; and, the purple dots are Subprinciples. Key Phrases appear as pink dots.  The gray dots are Commentary Paragraphs, Questions, Bullets, Figures, etc.

Figure 5 (below) includes some exploration (expansion) of Principal 2. Realize that you have nothing to fear from truth.

ray-dalio-principles-radically-transparent-plus

Figure 5. Principal 2. Realize that you have nothing to fear from truth.

Conclusions

In the end, extending the ModelMate platform to support the above produced more learning than what I’ve been able to glean from subsequent exploration of the #Graphitization of The Principles. Perhaps someone with more familiarity with The Principles can contact me with some interesting use cases. I’m extremely curious to derive more value from this model

This work on this project was made infinitely easier through the use of the ModelMate platform (powered by the Neo4j graph database).

To see a more meaningful visualization of The Principles, check out #Graphitization of Ray Dalio’s Principles: Iteration 2.

Best regards,

Michael Herman (Toronto)
Parallelspace Corporation
mwherman@parallelspace.net

7 Comments

Filed under Automated Application Architecture Analysis, Business Value, Data Science, Graphitization, How do we think, ModelMate, Progressive Enterprise Architecture Map (PEAM), The Principles

Crossing the EA Chasm: Automating Enterprise Architecture Modeling #2

[Updated November 6, 2016: Added Database/Web Services Farm Example #2]

In the previous article Crossing the EA Chasm: Automating Enterprise Architecture Modeling, I included a simple example of how a current state enterprise architecture model can be created and maintained automatically.

The same ModelMate enterprise architecture model has now been extended to include a total of 832,789 ArchiMate entities connected by 828,859 relationships (with several million property values) and was created automatically from scratch in about 15 minutes.

Database/Web Services Farm Example #1 (Single Subnet)

Below is a simple example of an automatically generated view depicting the database services and web services configured on the 38 servers connected to a particular IP subnet.  There’s a total of 355 nodes in this accurate and up-to-date current state view. (Click the image to enlarge it)

parallelspace-modelmate-web-database-server-farm1

Figure 1. Database/Web Services Farm Example #1 (Single Subnet)

Pretty cool. The green dots are database services (SQL Server instances to be exact – almost every possibly product edition can be found in this subnet: SQL Server Express, Developer, Enterprise, Datacenter, etc.) modeled as Infrastructure Services; the blue dots, servers (Windows physical and virtual servers) modeled as Infrastructure Nodes; and, the purple dots, web servers (IIS virtual directory applications to be exact) modeled as Infrastructure Functions.

The small orange dots represent the network adapter configurations of the network adapters configured into each server.  The most central dot is the IP gateway (network router) for this subnet.

Database/Web Services Farm Example #2 (All Subnets/All Farms)

Parallelspace ModelMate-Web-Database Server Farms2.png

Figure 2. Database/Web Services Farm Example #2 (All Subnets/All Farms)

The red dots are IP subnets (32 in this ModelMate view) connecting 208 server Nodes that host either a SQL Server Instance (376 Infrastructure Service elements) and/or an IIS Virtual Directory Application (1597 Infrastructure Function elements).  The small orange dots are network adapter configurations. (Click the image to enlarge it)

Microsoft Exchange Server Farm Example

Here’s one more example of an auto-generated view from the same ModelMate model: a Microsoft Exchange email, collaboration, and unified communications services farm. In this view, the blue dots are the Windows Services running on each of these 3 Windows Servers in this view (out of a total of 5 servers in the complete farm). The orange dot highlighted in gray near the top of the server on the right side, for example, is an IIS virtual directory application that is hosting an Outlook Web Access (OWA) web service. (Click the image to enlarge it)

Parallelspace ModelMate-Exchange Server Farm.png

Figure 3. Microsoft Exchange Server Farm Example

The larger red entity contains all of the descriptive information (metadata) for each server’s processor; the smaller red dot, the memory configuration for the server.

The Neo4j  graph database from Neo Technologies was used as a key component of the ModelMate platform. A special ModelMate tool was created for automatically uploading any SQL Server database into a graph database (including all tables, columns, primary keys, primary key constraints, composite keys, foreign keys, foreign key relationships, implied entity relationships, NULL value processing, DateTime data type handling, etc.).

Have a great weekend,

Michael Herman (Toronto)

Parallelspace Corporation

mwherman@parallelspace.net

*ArchiMate is a registered trademark of The Open Group.

4 Comments

Filed under ArchiMate, Architecture Reference Models, Automated Enterprise Architecture Modeling, Crossing the EA Charm, Data Science, Enterprise Architecture, ModelMate

ModelMate Architecture Reference Model

[Updated October 28, 2016]

This article describes the architecture reference model for deploying a comprehensive, integrated enterprise architecture modeling and data science platform based on ModelMate.

The audience for this article is IT professionals including enterprise architects, solution architects, and security architects who want increased visibility into the deployment of their custom applications, entire data center environments, business process definitions, and LOB applications such as SAP, Oracle Financials, Salesforce, Microsoft SharePoint, and Microsoft Dynamics CRM.

A primary use case is organizations with a requirement to move one or more on-premise applications or capabilities to the cloud or need a better understanding of how their hybrid on-premise/cloud environments (e.g. Salesforce cloud applications and on-premise or third-party customer loyalty solutions).

ModelMate

Quoting from Crossing the EA Chasm: Open Repository Strategies for Enterprise Architecture, “ModelMate is a working implementation of a Microsoft SQL Server and Neo4j graph database-based repository for managing arbitrarily large collections of arbitrary entities, properties, relationships, views, etc.to enable analysis, visualization, and understanding using easily-available open source and COTS (commercial off the shelf) business intelligence (BI), data visualization, and machine learning (ML) platforms, tools and cloud services.”

The primary goal of ModelMate is to provide automated support for the Continuous Transformation Framework of the Progressive Enterprise Architecture Model (PEAM) depicted in Figure 1.

progressive-ea-model-1-0-9-peam3-ea-chasm-auto-dots

Figure 1. Progressive Enterprise Architecture Model

Continuous Transformation Framework

The Continuous Transformation Framework is a Deming Cycle based on the following 4 phases:

  1. Listening & Learning
  2. Knowledge > New Designs
  3. Plan & Act
  4. Transformative Change > New Outcomes

The Framework is depicted as a continuous cycle as shown in Figure 1 above. The Framework can also be flattened and presented as a (repeating) sequence of 4 processes (Figure 2).

peam-continuous-transformation

Figure 2. Continuous Transformation Framework

Why all of this discussion about PEAM and the Continuous Transformation Framework? It is because to be able to understand and value the ModelMate Architecture Reference Model, it’s important to understand the class of problems it is trying to solve. Automated support for Continuous Transformation is the pain; ModelMate is the pain killer.

ModelMate Architecture Reference Model

There are 3 high-level layers in the ModelMate Architecture Reference Model:

  • Apps that use the ModelMate repository
  • Continuous Transformation Framework
  • ModelMate Open Hybrid Repository (MOHR)

These 3 layers (and 4 categories of apps) are illustrated in Figure 3.  Each app category corresponds to one phase in the Continuous Transformation Framework.

marm-modelmate-open-hybrid-repository-app-categories

Figure 3. ModelMate Architecture Reference Model: 3 Layers

The choice of apps that your organization selects for each category depends on the medium-term and long-term drivers and goals for your enterprise architecture program. The app groups map to specific phases of the Framework:

  1. Listen & Learn phase
    • Ingestion
  2. Knowledge > New Designs phase
    • Pure Modeling and Layout apps
    • Modeling, Layout & Visualization apps
    • Data Science apps
    • Custom Mobile and Web apps
  3. Plan & Act phase
    • Program & Project Management apps
  4. Transformative Change > New Outcomes phase
    • Operations and Change Management apps

Figure 4 lists a sample or representative list of applications that can fulfill the needs of each app category (each phase of the Continuous Transformation Framework).

marm-modelmate-open-hybrid-repository-apps

Figure 4. ModelMate Architecture Reference Model: Apps

Ingestion

Ingestion apps are responsible for scanning the enterprise’s operational environment: systems, assets, and processes. Information captured about each entity includes its structure, metadata, performance and usage data.  Operational business data is usually not needed and not captured.

Sources of data include business process logs, configuration management databases, LOB application configurations (SAP, SharePoint, Salesforce, Microsoft Dynamics CRM, Oracle Financials, etc.), operations management systems (Azure OMS, Microsoft System Center, etc.), Microsoft MAP Toolkit, performance monitoring logs, usage and audit logs, etc.

These are inbound data sources used to automatically update and maintain the EA models stored in ModelMate. Ingestion apps are the primary data sources for the Listen & Learn phase of the Continuous Transformation Framework.

Pure Modeling and Layout Apps

There are several types of apps that comprise the Knowledge > New Designs phase of the Framework.  Pure Modeling and Layout Apps are applications that support the manual modeling of entities, relationships, and metadata as well as the manual layout of stakeholder specific views.

The apps in the group do not support any built-in analysis and visualization capabilities beyond manually-created basic views. In addition, pure modeling and layout apps do not include an end-user scripting capability for performing automated, user-defined custom analysis or visualization.

Archi is an example of a pure modeling and layout app.

Modeling, Layout & Visualization Apps

These types of apps support manual modeling of entities, relationships and metadata and the manual layout of stakeholder specific views but also include basic, advanced, and/or custom analysis and visualization capabilities.

BiZZdesign Enterprise Studio and other advanced EA modelers are examples of apps that belong to the Modeling, Layout & Visual Apps group – supporting the needs of the Knowledge > New Designs phase of the Framework.

Data Science Apps

Data Science Apps include non-traditional “enterprise architecture” modeling and analysis apps. This group includes both open sources as well as COTS (commercial off the shelf) data science tools and platforms. Data Science apps provide advanced analysis, machine learning and visualization capabilities enabled through open access to enterprise architecture data via standard protocols and APIs (e.g.ArchiMate Exchange File Format, OData, SQL Server stored procedures, entity models, and advanced query and analysis languages such as R, Cypher, and T-SQL).

Examples of Data Science apps include: R Studio, Microsoft Power BI, Tableau, Domo, Linkurious, Microsoft Excel and the Neo4j graph browser.

Custom Mobile and Web Apps

This is the last group of apps that support the Knowledge > New Designs phase of the Framework and includes both no-code and code platforms for creating custom reporting, analysis, visualization apps.

No-code custom apps designed with Microsoft PowerApps (and Microsoft PowerFlow) are examples of the former; traditional C#/VB.Net, Java, and Node.js/JavaScript apps are examples of the latter.

Program & Project Management Apps

Program & Project Management Apps support the Plan & Act phase of the Framework.

Traditional portfolio, program, and project managements apps are examples of applications in this group. Collaboration tools such as Microsoft SharePoint, Confluence, and Jira can also belong in this group. Collaboration tools can also be considered as “horizontal” solutions that can be used across all phases of the Framework.

Operations and Change Management Apps

All of the effort to create and manage a functioning enterprise architecture solution only realizes direct business value when it leads to Transformative Changes being made in the enterprise’s strategies, systems, assets, and processes; and measurable, positive New Outcomes result from the changes.

Examples of apps in this category include change management applications that support IT Service Management (ITSM) disciplines such as ITIL. ServiceNow is an example of an ITSM app.

Please provide your feedback in the Comments section below or feel free to email me directly.

Best regards,
Michael Herman (Toronto)
Parallelspace Corporation
mwherman@parallelspace.net

*ArchiMate is a registered trademark of The Open Group.

All other trademarks, servicemarks, registered trademarks, and registered servicemarks are the property of their respective owners.

4 Comments

Filed under ArchiMate, Automated Application Architecture Analysis, Automated Enterprise Architecture Modeling, Business Value, continuous transformation, Crossing the EA Charm, Data Science, ModelMate, Power BI, Progressive Enterprise Architecture Map (PEAM), Salesforce, SharePoint

Crossing the EA Chasm: Automating Enterprise Architecture Modeling #1

If you have been following my Crossing the EA Chasm blog series (and related articles), you’ll have noticed a number of common themes:

Automating Enterprise Architecture Modeling

Automated enterprise architecture modeling (and automated application architecture analysis) are activities that belong to the Listening and Learning phase of the Continuous Transformation Framework.

Progressive EA Model 1-0-9-PEAM3-EA Chasm-Auto-Dots.png

Figure 1. Progressive Enterprise Architecture Model: Continuous Transformation Framework

Supporting the above themes, the Technology layer diagram below is automatically generated from a simple, single line query applied to an automatically created and dynamically maintained model of 500+ Windows and Linux servers (blue dots) with 550+ server network adapter configurations (yellow dots) connected to 25 network gateways (blue dots representing 25 network routers/switches). The data originates from a series of tables maintained by a configuration management database (CMDB) solution. There is no way to understand what the Technology environment looks like by simply looking at these tables.  However, in the visualization below, it is easy to see that there are at least 14 different server farms, application clusters, and data centers.

Parallelspace TEAM-DevicesA.png

Figure 2. Automatically Generated Technology Layer Model and View

In this ModelMate model, servers are represented by Nodes with 179 properties;  network adapter configurations as Devices with 69 properties each; and, network gateways as Devices with 4 properties per device.

This is just the beginning as additional information about web application, database, DNS, and directory and domain management services is used to add additional  detail to the current state Technology layer of this enterprise architecture. “More news at 11…” (click here).

This effort was made easier through the use of ModelMate and the Neo4j Community Edition free, open source graph database and the Cypher query language.

Best regards,

Michael Herman (Toronto)

Parallelspace Corporation

mwherman@parallelspace.net

4 Comments

Filed under ArchiMate, Architecture Reference Models, Automated Application Architecture Analysis, Automated Enterprise Architecture Modeling, Crossing the EA Charm, Data Science, Enterprise Architecture, ModelMate, Progressive Enterprise Architecture Map (PEAM), The Open Group

#Graphitization of .NET Applications: Marrying Open EA Data with Graph Databases

[Updated October 20, 2016]

As I’ve worked to support open access to enterprise architecture data by creating the ModelMate project, the range and diversity of how enterprise data can be analyzed and visualized has proved to be amazing.  Here’s yet another example: the marrying of open EA data in ModelMate models with a graph database platform …in less than 1 day.

The native (schema-less) representation for a graph database mirrors the ArchiMate* metamodel one-for-one:

  • Entities that support named types (“labels”)
  • Relationships between directed pairs of entities that also support named types (“relationship types”)
  • Unlimited property sets per entity
  • Unlimited property sets per relationship

Add to this, powerful query capabilities, a small footprint, and hyper-scalability. For example, being able to find all of the ArchiMate concepts that are 1, 2, 3, or an infinite number of relationships away from each of the Application Components in a large model and have these queries run and visualize in milliseconds (see the examples below).

For ModelMate’s first graph database integration, Neo4j from Neo Technologies was used. It was simple and efficient to install and was useable within a few minutes.  After working most of the morning to learn the Cypher query language to integrate and query the ModelMate data, the afternoon was spent exploring the graph model and experimenting with a range of queries. The most recent ModelMate logical architecture looks like the following (October 19, 2016).

modelmategraphdbhighlighted

Figure 1. ModelMate Logical Architecture

Automated Application Architecture Analysis

What are some of the results?  Here’s a series of views created with simple, single-line queries against the ModelMate graph. The scenario is automated application architecture analysis to support migration of on-premise applications to the cloud.

This version of the VetContext ModelMate model used for this example included:

  • 8714 elements (nodes) – files, assemblies, modules, methods, fields, method calls, and field references represented as ArchiMate application and technology layer concepts
  • 16,210 relationships – modeled as ArchiMate relationships that linked the above elements into a ModelMate graph

TIP: If you click on each image, you can check out the single line query at the top of each screenshot.

vetcontexta

Figure 2. Application Architecture: Contains and References Relations (1 hop)

vetcontextb

Figure 3. Application Architecture: Contains, Defines, and References Relations (2 hops)

vetcontextd

Figure 4. Application Architecture: Accesses, Calls, Contains, Defines, References, References and Type For Relations (3 hops)

vetcontextz

Figure 5. Application Architecture: Visualize Relations between all Application Components, Artifacts, and System Software Components (any number of hops)

vetcontexte

Figure 6. VetContext ModelMate Graph: All Application Components (any number of hops)

In Figure 7 below you can see the much smaller VetContext application in the green circle in contrast with all of the public classes and methods found in the Entity Framework assembly from Microsoft (blue circle).

VetContextEFHighlighted.png

Figure 7. VetContext Application References into the Microsoft Entity Framework

Impressive for 1-day’s worth of effort (including training).

Best regards,
Michael Herman (Toronto)
Parallelspace Corporation

Mail: mwherman@parallelspace.net

p.s. What is the VetContext ModelMate model that I’m using for these blog postings?

The VetContext ModelMate model is based on the Microsoft Entity Framework sample of the same name from the book Programming Entity Framework: Code First by Julia Lerman and Rowan Miller. The ModelMate model is comprised of data from all of the .NET assemblies, modules, type definitions (including classes, enums, etc.), method definitions, field definitions, method calls and field accesses as well as the physical files that store the assemblies in the VetContext sample application. A simplified VetContext class diagram (from Visual Studio) appears below.

vetcontextclasshierarchy

Figure 8. VetContext Class Diagram

The ModelMate Scanner for .NET Application Migration reads a folder of all of the .exe and .dll files for one or more .NET applications and builds the ModelMate model. No source code is needed. The scanner reads and parses the intermediate language (MSIL) directly.

p.p.s. The original ModelMate SQL Server schema (the original data source for the ModelMate graph) looks similar to the following. This was used before ModelMate included support for graph databases.

modelmateschema-views

Figure 9. ModelMate SQL Server (non-graph database) Schema
(obsoleted by the ModelMate migration to Neo4j graph database)

 * ArchiMate is a registered trademark of The Open Group.

3 Comments

Filed under ArchiMate, Automated Application Architecture Analysis, Crossing the EA Charm, Data Science, Enterprise Architecture, Graphitization, Progressive Enterprise Architecture Map (PEAM), The Open Group