Tag Archives: Enterprise Architecture

Using #Graphitization to Create Your Organization’s Digital Twin

Original title: #Graphitization of the Enterprise

COPYRIGHT © 2016-2017 by Michael Herman, Toronto Canada. All rights reserved. [Updated June 16, 2018]

This article is the first in a series on #Graphitization. Click here to explore the other articles in this series.

Reprinted from #Graphitization of the Enterprise on LinkedIn.

Move beyond digitalization of the enterprise to graphitization of the enterprise, the creation of your organization’s digital twin. Here’s a great diagram that explains this concept. (click on the diagram to enlarge it)

graphitization-new-world-of-it
Figure 1. Digital Twin Model of IT

Graphitization of not only all of your corporate information assets across all of your constituencies and stakeholders – at the data, application entity, and business object level – but also the graphitization of all of the interconnections between every business process, application system, infrastructure component, cloud service, vendor/service provider, and business role that uses, manages, or stores corporate information (Crossing the EA Chasm: Automating Enterprise Architecture Modeling #2).

Use graphitization to make your existing corporate information more available, more usable, and more informative. Graphitization enables you to “Keep Calm and Have IT Your Way“.

What is #Graphitization?

#Graphitization is a data science and enterprise architecture-inspired framework and process model for modeling, ingesting, organizing, analyzing, and visualizing any domain of endeavor by using graphs – networks of connected objects and relationships with each object and relationship annotated with additional descriptive information (metadata).

The primary applications of #Graphitization are:

  • System optimization,
  • Systems life cycle management, and
  • Transformative Change in resulting in positive increases in business value for the system being studied.

A system is defined as any collection of strategies, system components, assets, architectures or processes.

Using #Graphitization

Use graphitization of your organization to help close both the Enterprise Architecture Chasm and the Operational Data Chasm. See below.

progressive-ea-model-1-0-11-peam4-operational-data-chasm
Figure 2. Continuous Transformation Framework: Enterprise Architecture Chasm and Operational Data Chasm

progressive-ea-model-1-0-11-peam5-1010
Figure 3. Continuous Transformation Framework: Processes and Activities

To learn more about other applications of graphitization, check out the following articles:

Michael Herman (Calgary)
mwherman@parallelspace.net

6 Comments

Filed under continuous transformation, Crossing the EA Charm, Data Science, Digital Transformation, Enterprise Architecture, Enterprise Architecture Chasm, Graphitization, ModelMate, Operational Data Chasm, Progressive Enterprise Architecture Map (PEAM)

ModelMate Architecture Reference Model

[Updated October 28, 2016]

This article describes the architecture reference model for deploying a comprehensive, integrated enterprise architecture modeling and data science platform based on ModelMate.

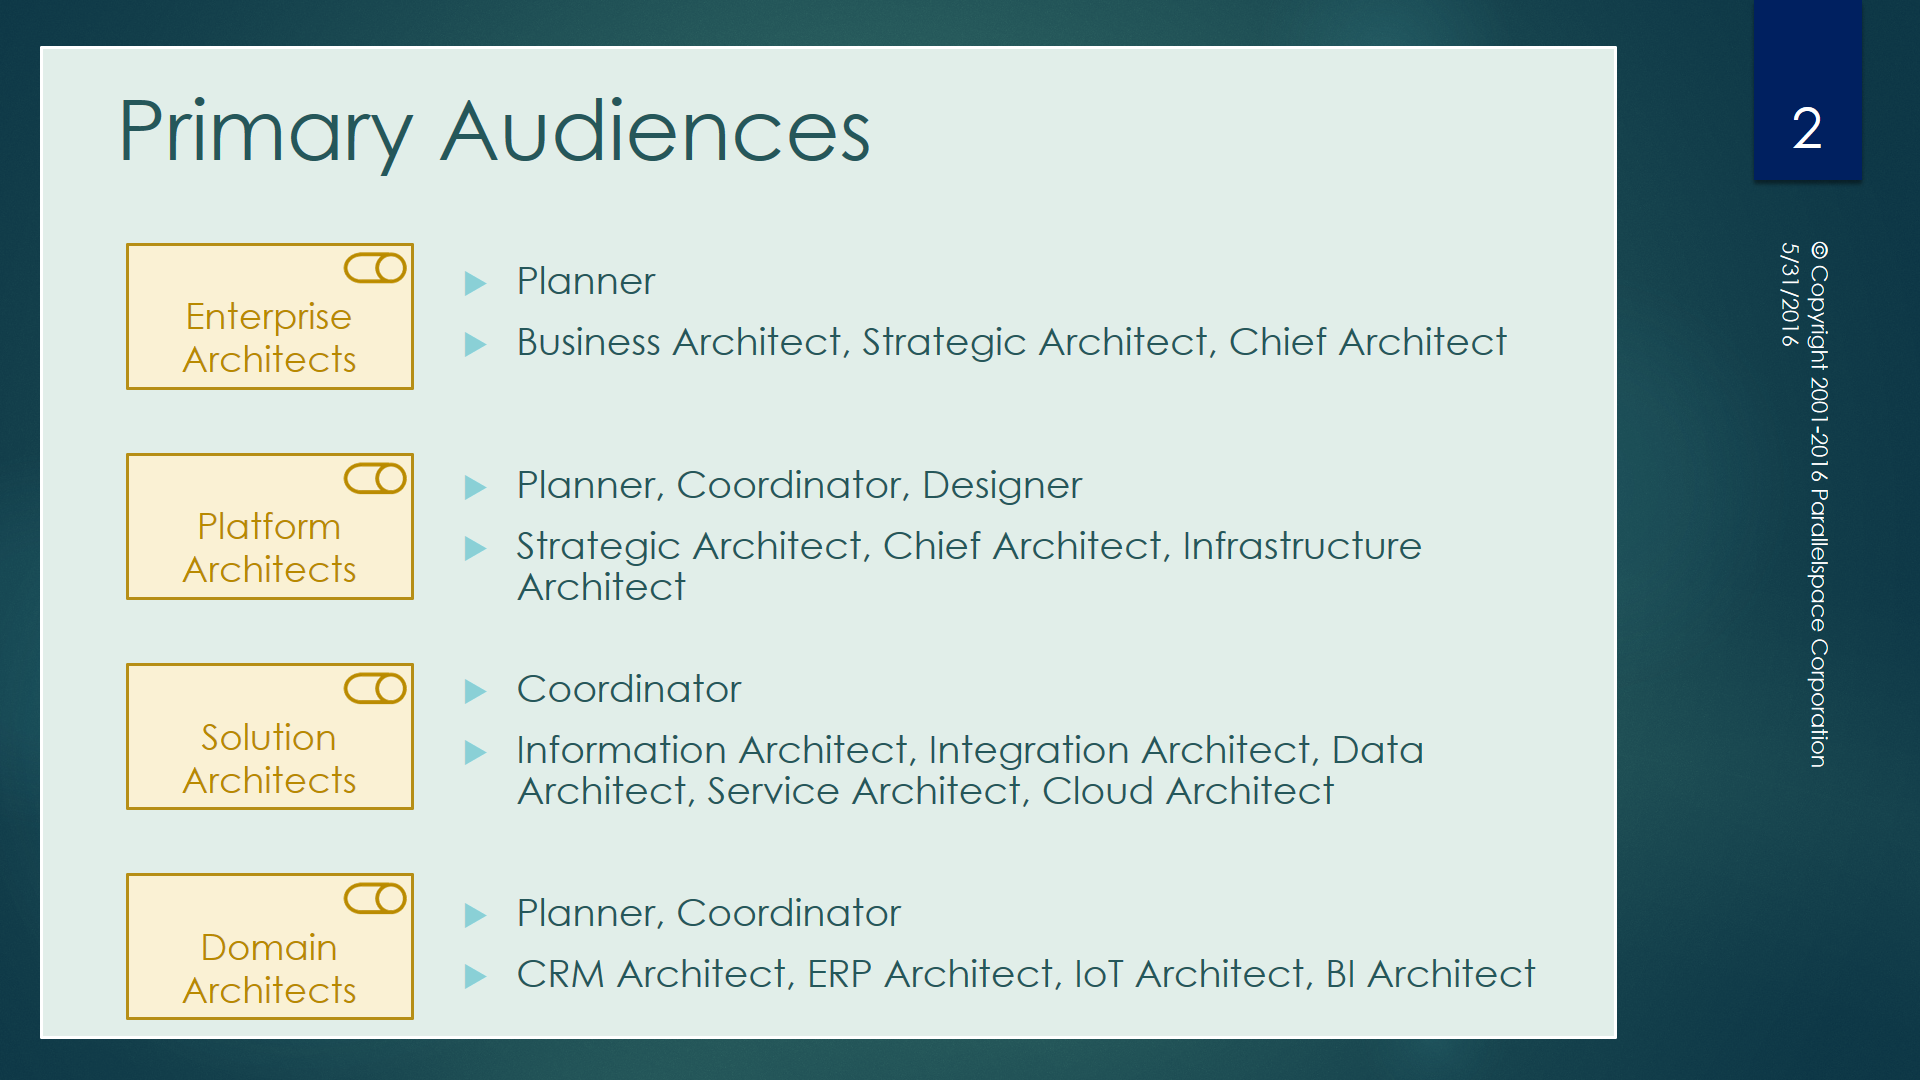
The audience for this article is IT professionals including enterprise architects, solution architects, and security architects who want increased visibility into the deployment of their custom applications, entire data center environments, business process definitions, and LOB applications such as SAP, Oracle Financials, Salesforce, Microsoft SharePoint, and Microsoft Dynamics CRM.

A primary use case is organizations with a requirement to move one or more on-premise applications or capabilities to the cloud or need a better understanding of how their hybrid on-premise/cloud environments (e.g. Salesforce cloud applications and on-premise or third-party customer loyalty solutions).

ModelMate

Quoting from Crossing the EA Chasm: Open Repository Strategies for Enterprise Architecture, “ModelMate is a working implementation of a Microsoft SQL Server and Neo4j graph database-based repository for managing arbitrarily large collections of arbitrary entities, properties, relationships, views, etc.to enable analysis, visualization, and understanding using easily-available open source and COTS (commercial off the shelf) business intelligence (BI), data visualization, and machine learning (ML) platforms, tools and cloud services.”

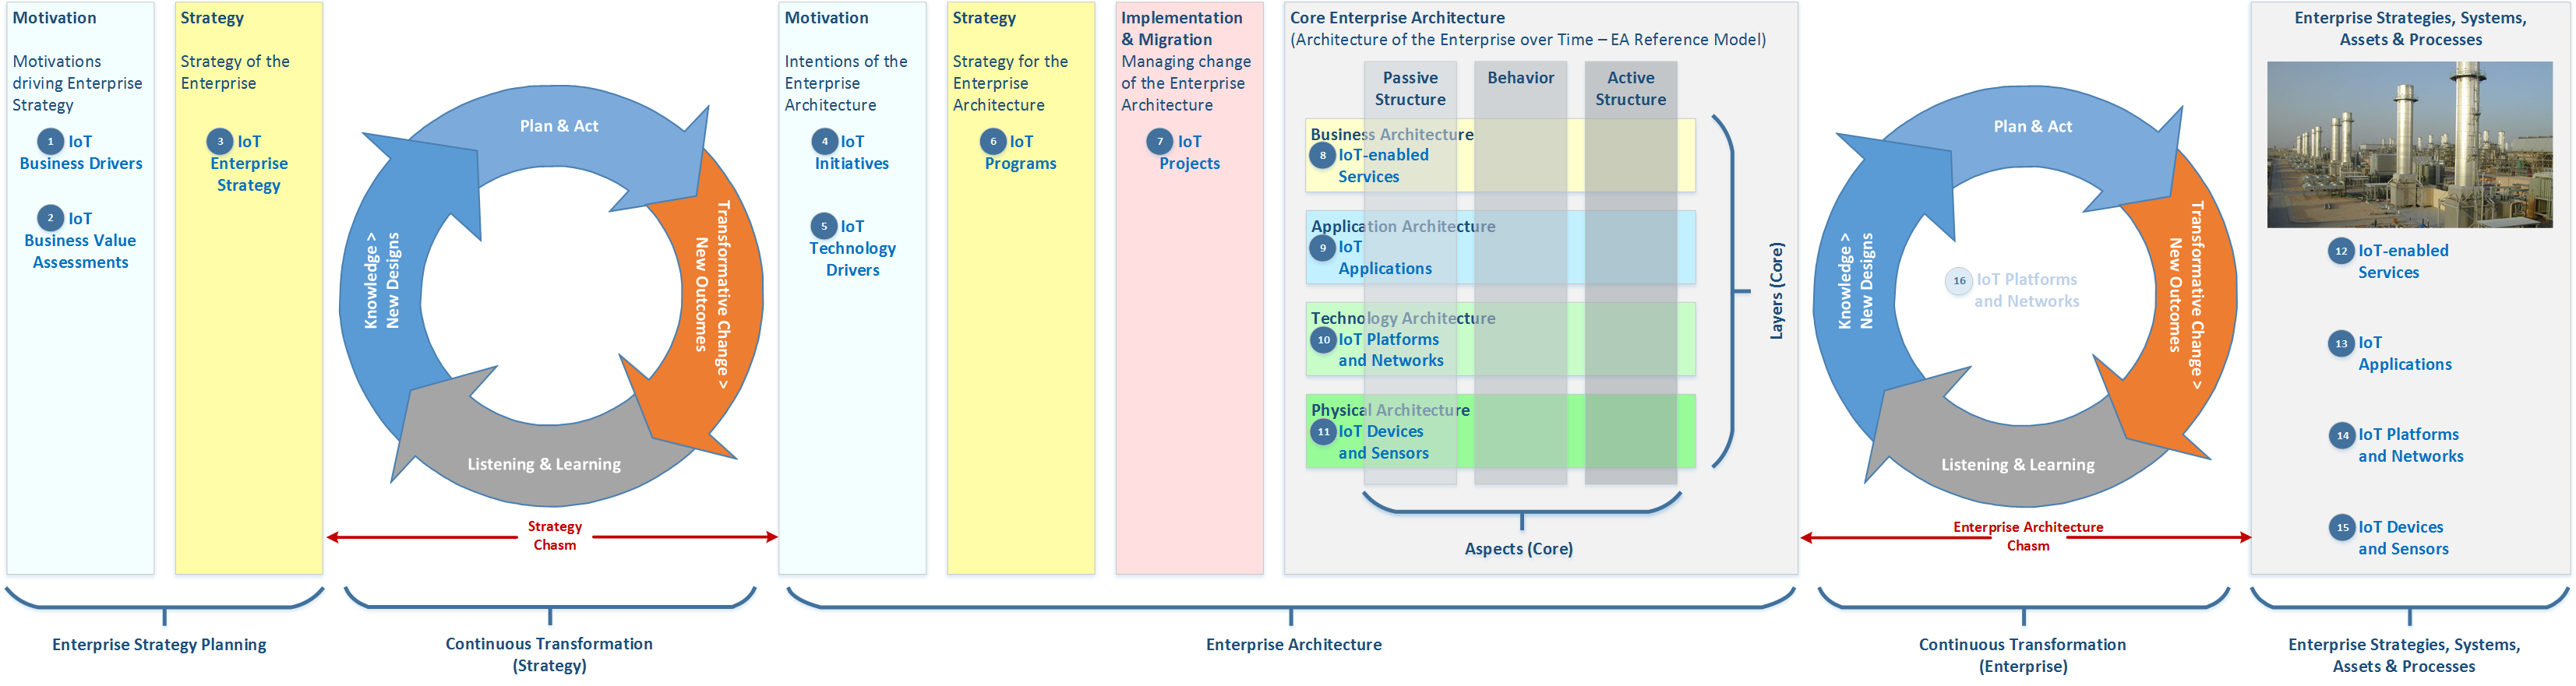
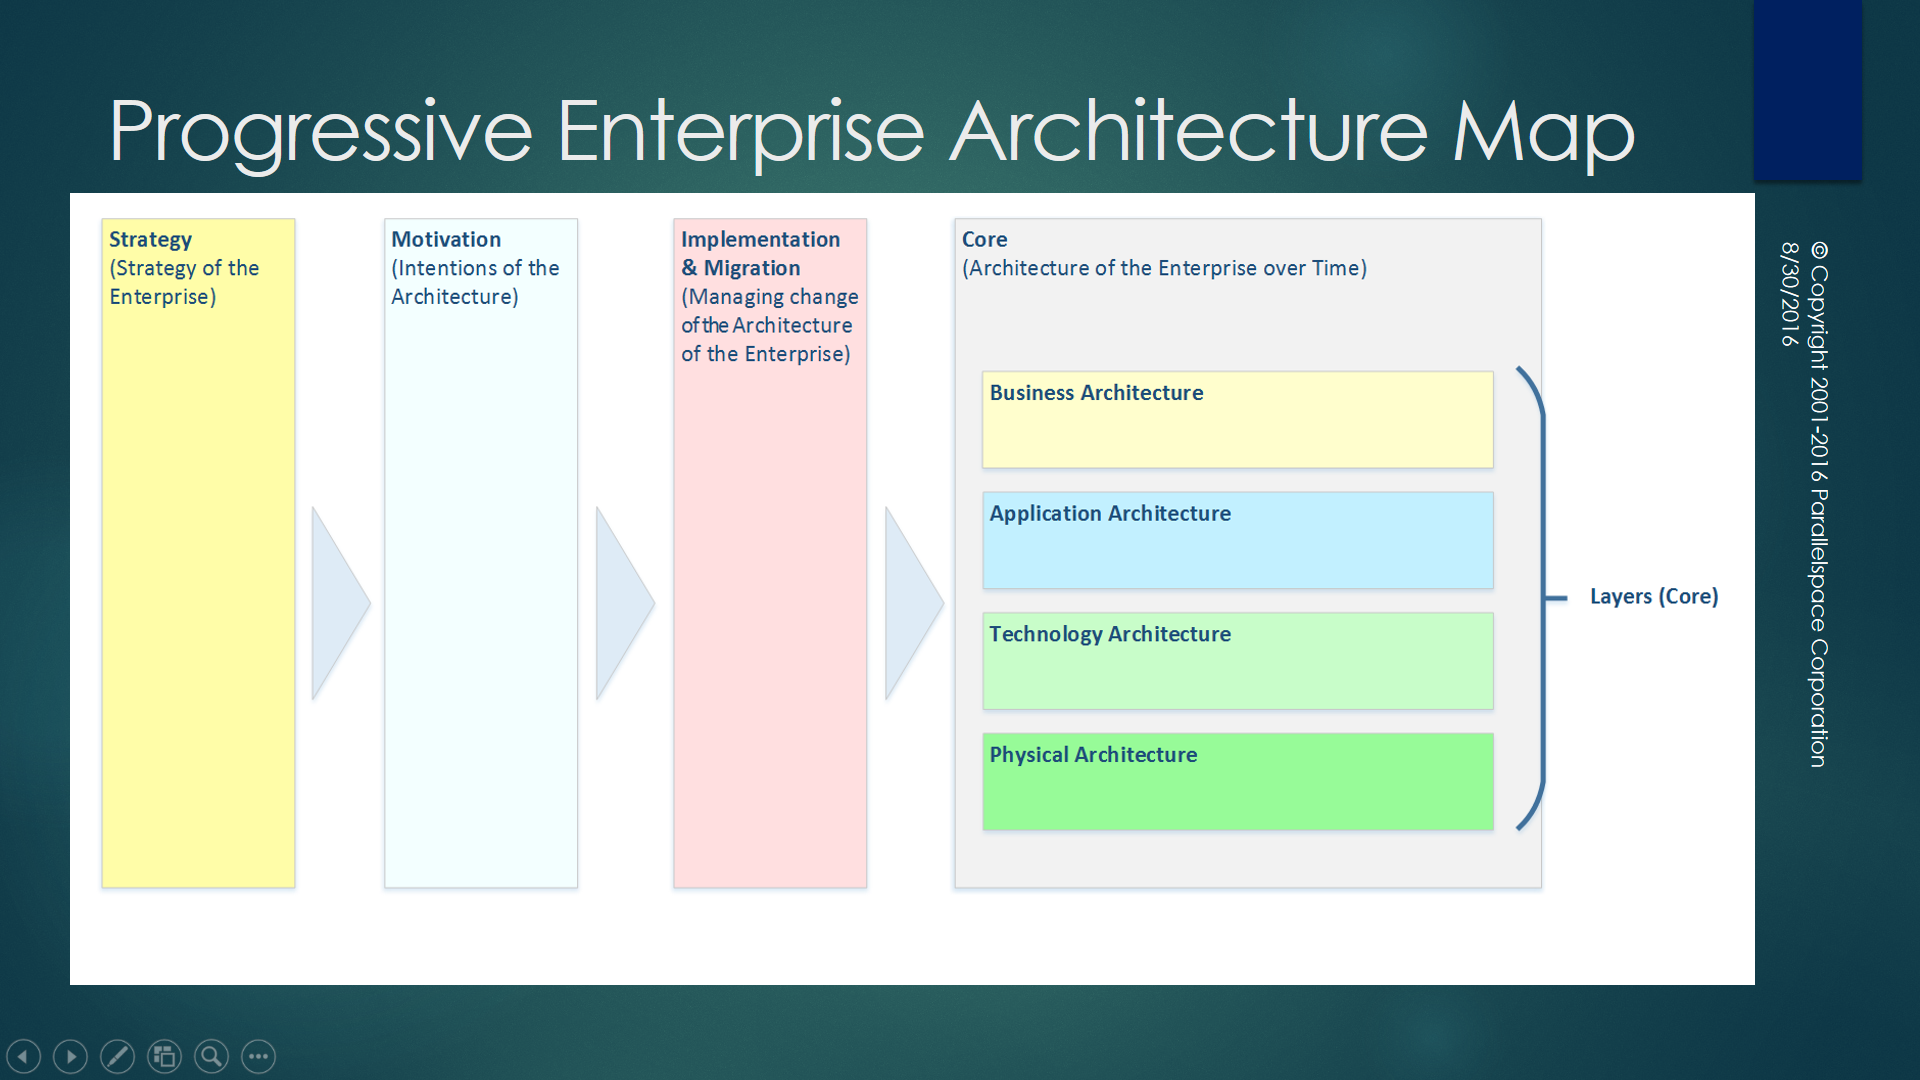
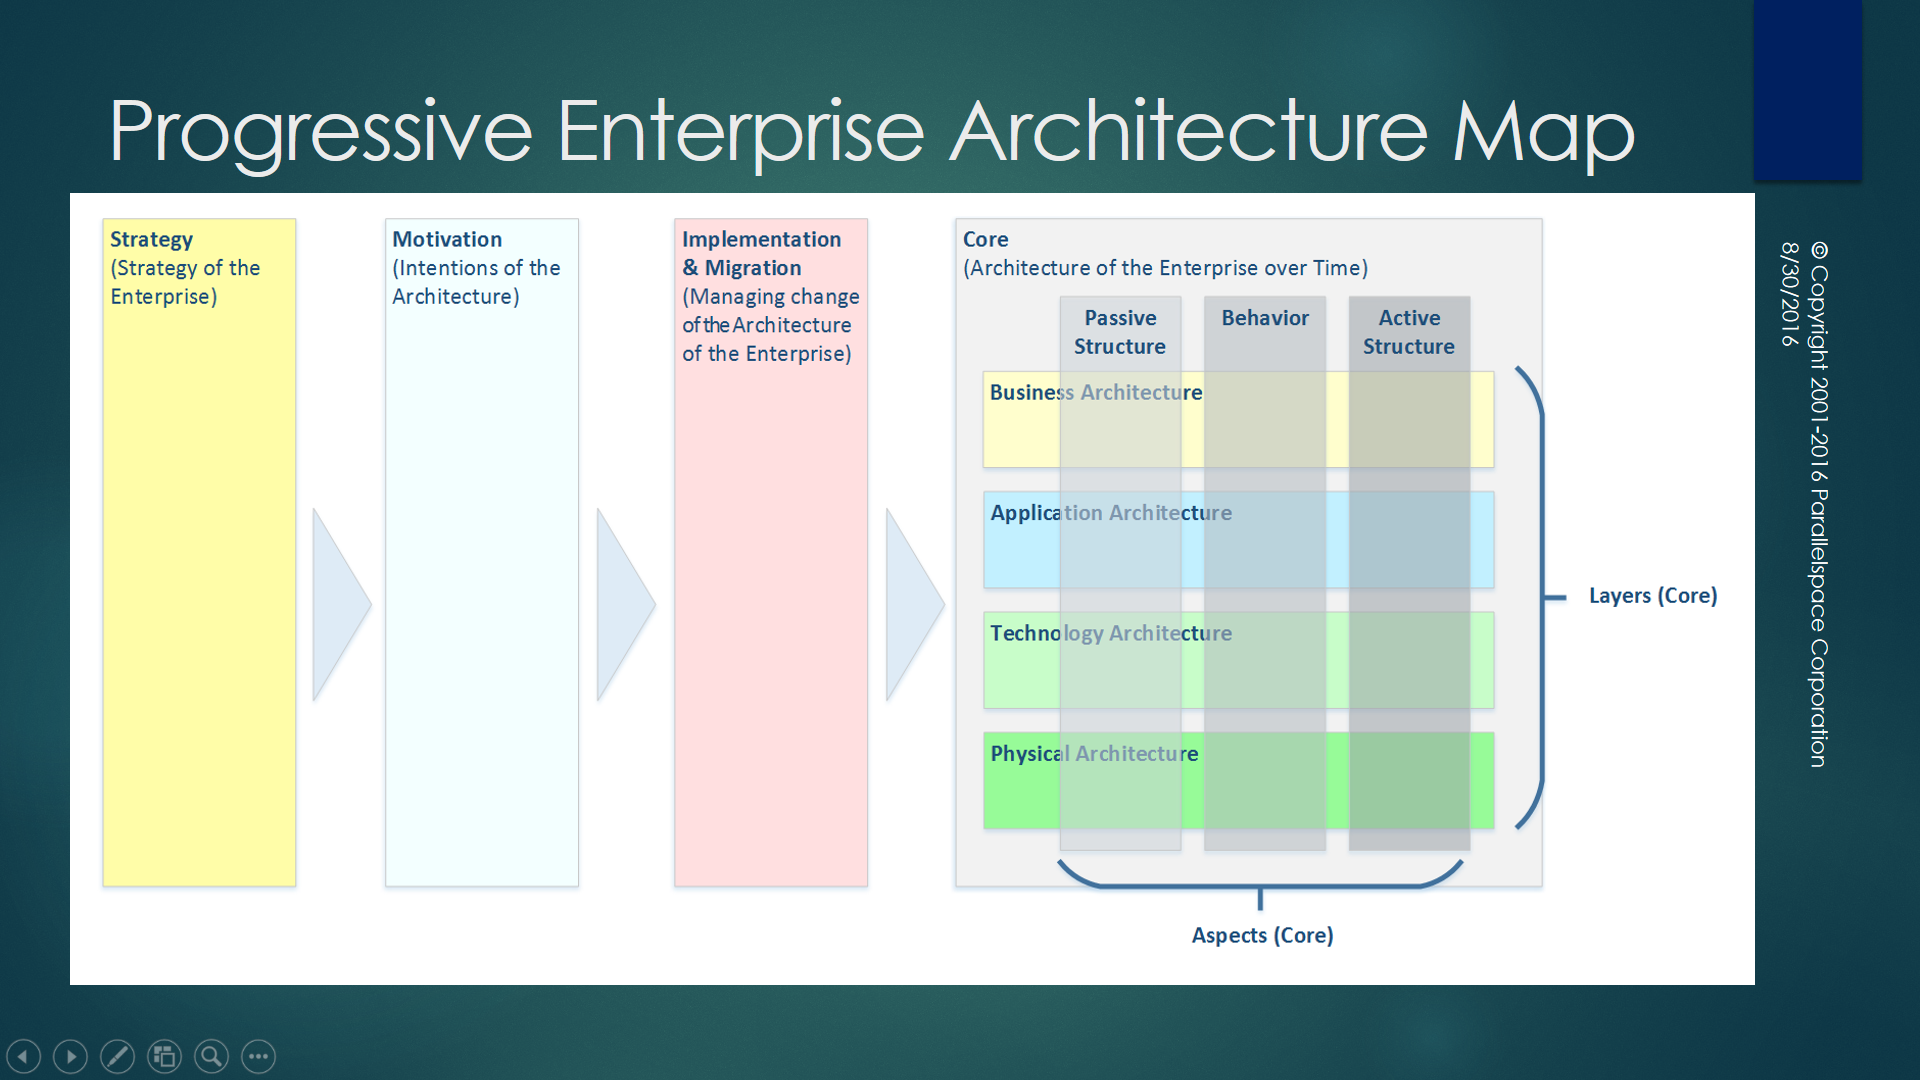
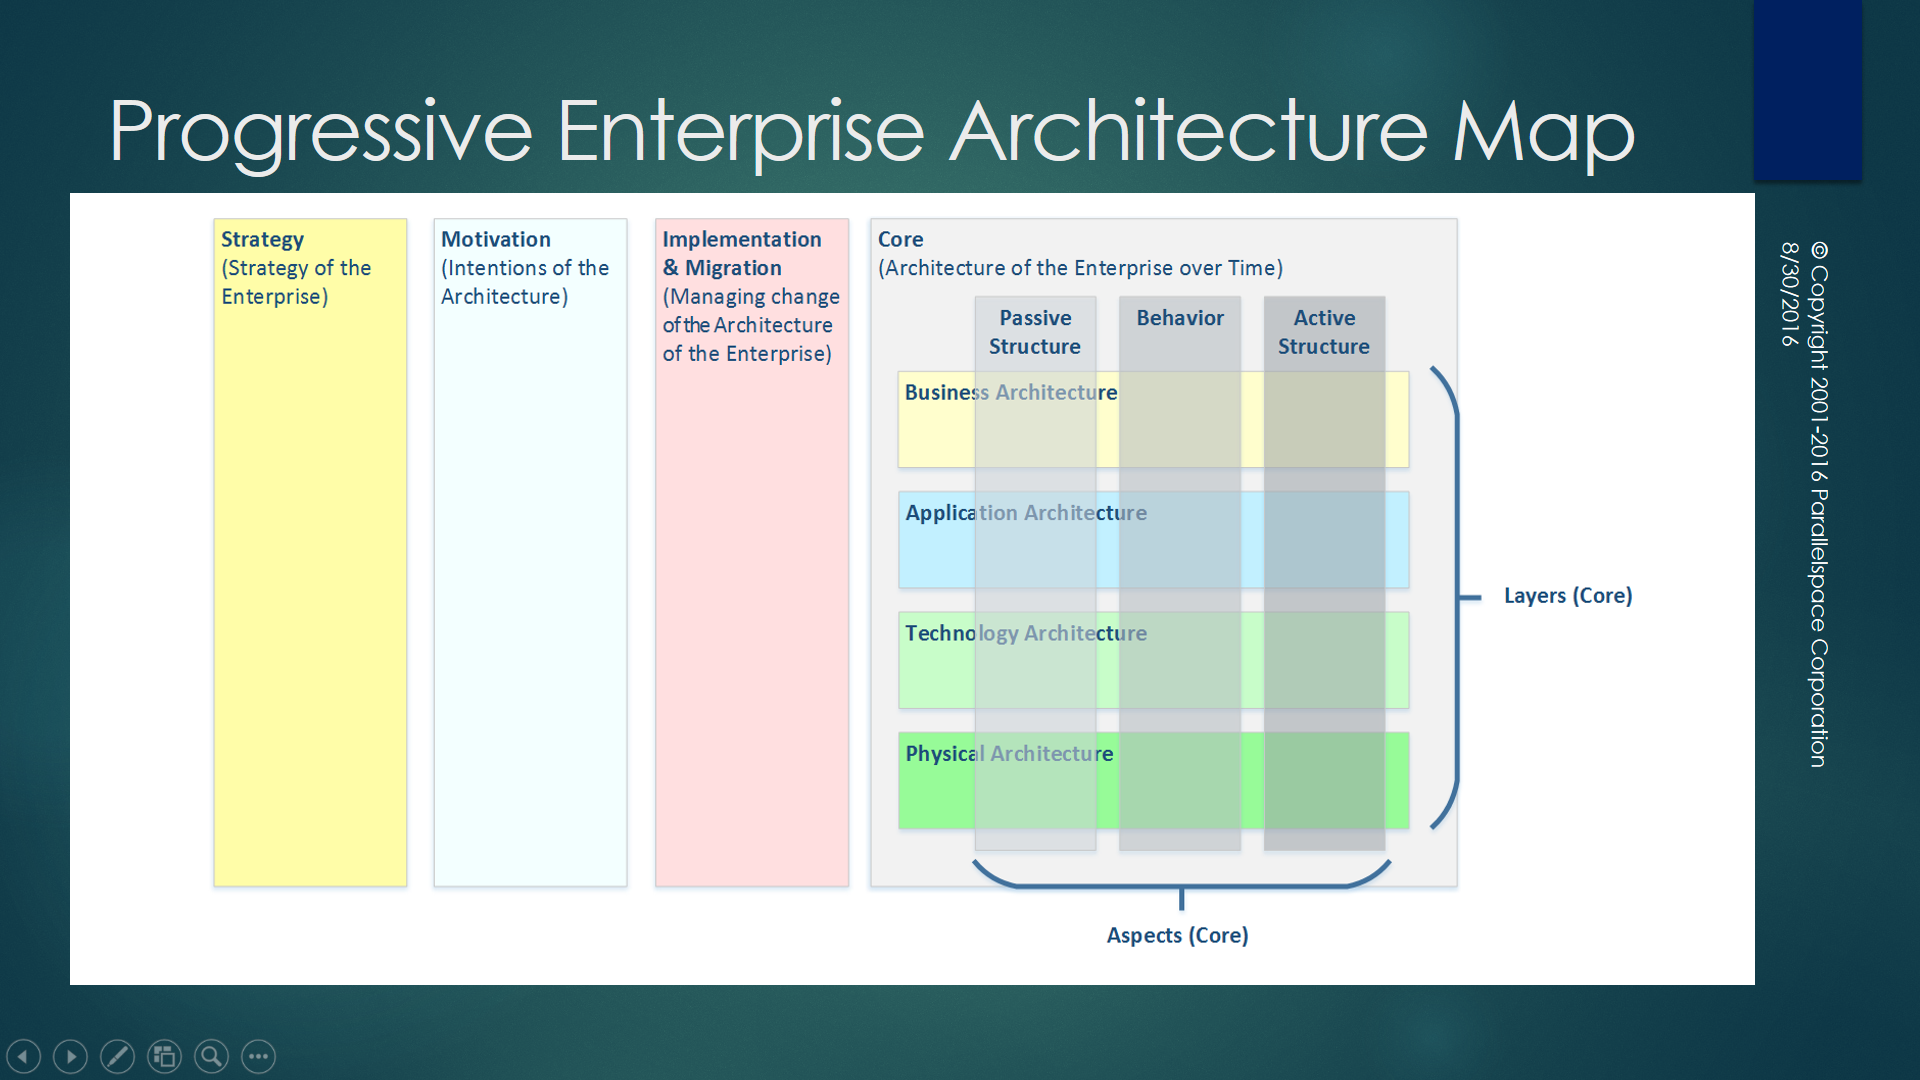
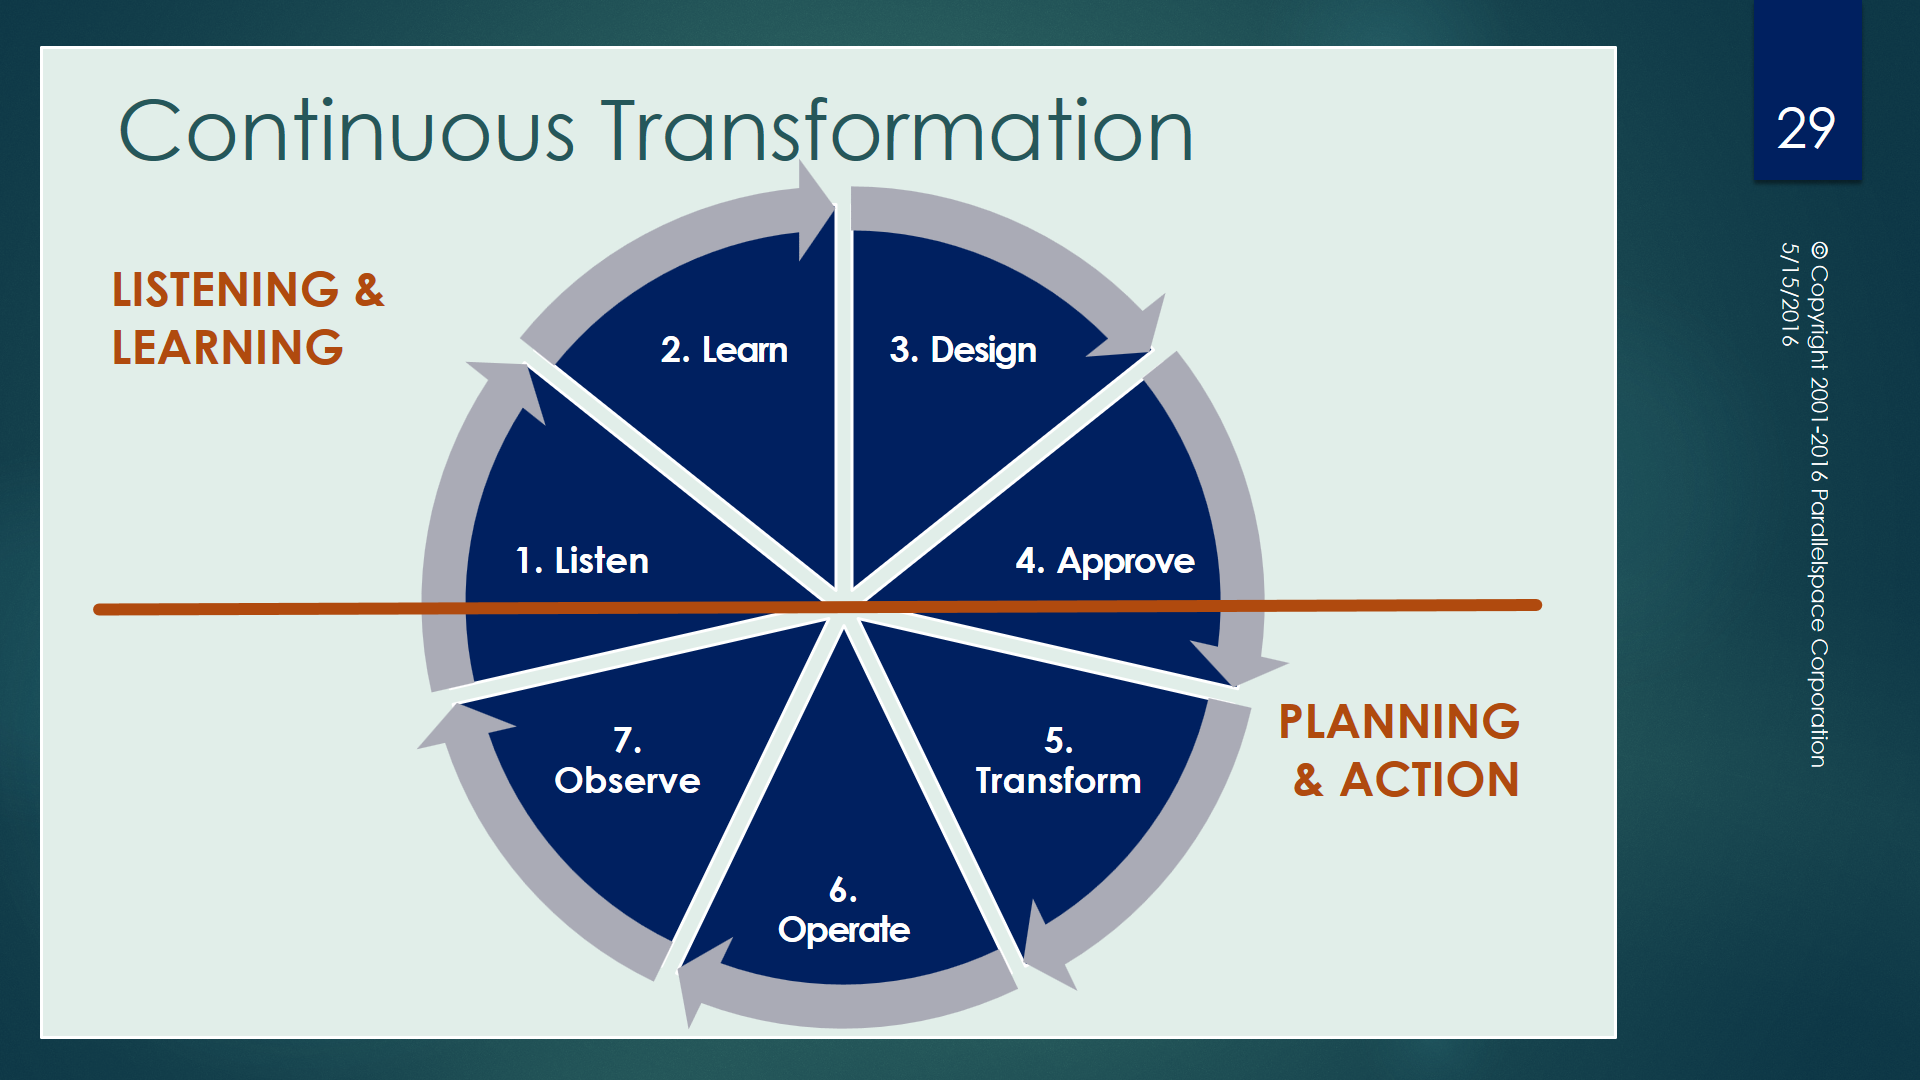
The primary goal of ModelMate is to provide automated support for the Continuous Transformation Framework of the Progressive Enterprise Architecture Model (PEAM) depicted in Figure 1.

progressive-ea-model-1-0-9-peam3-ea-chasm-auto-dots

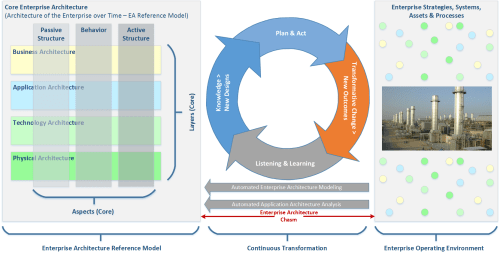
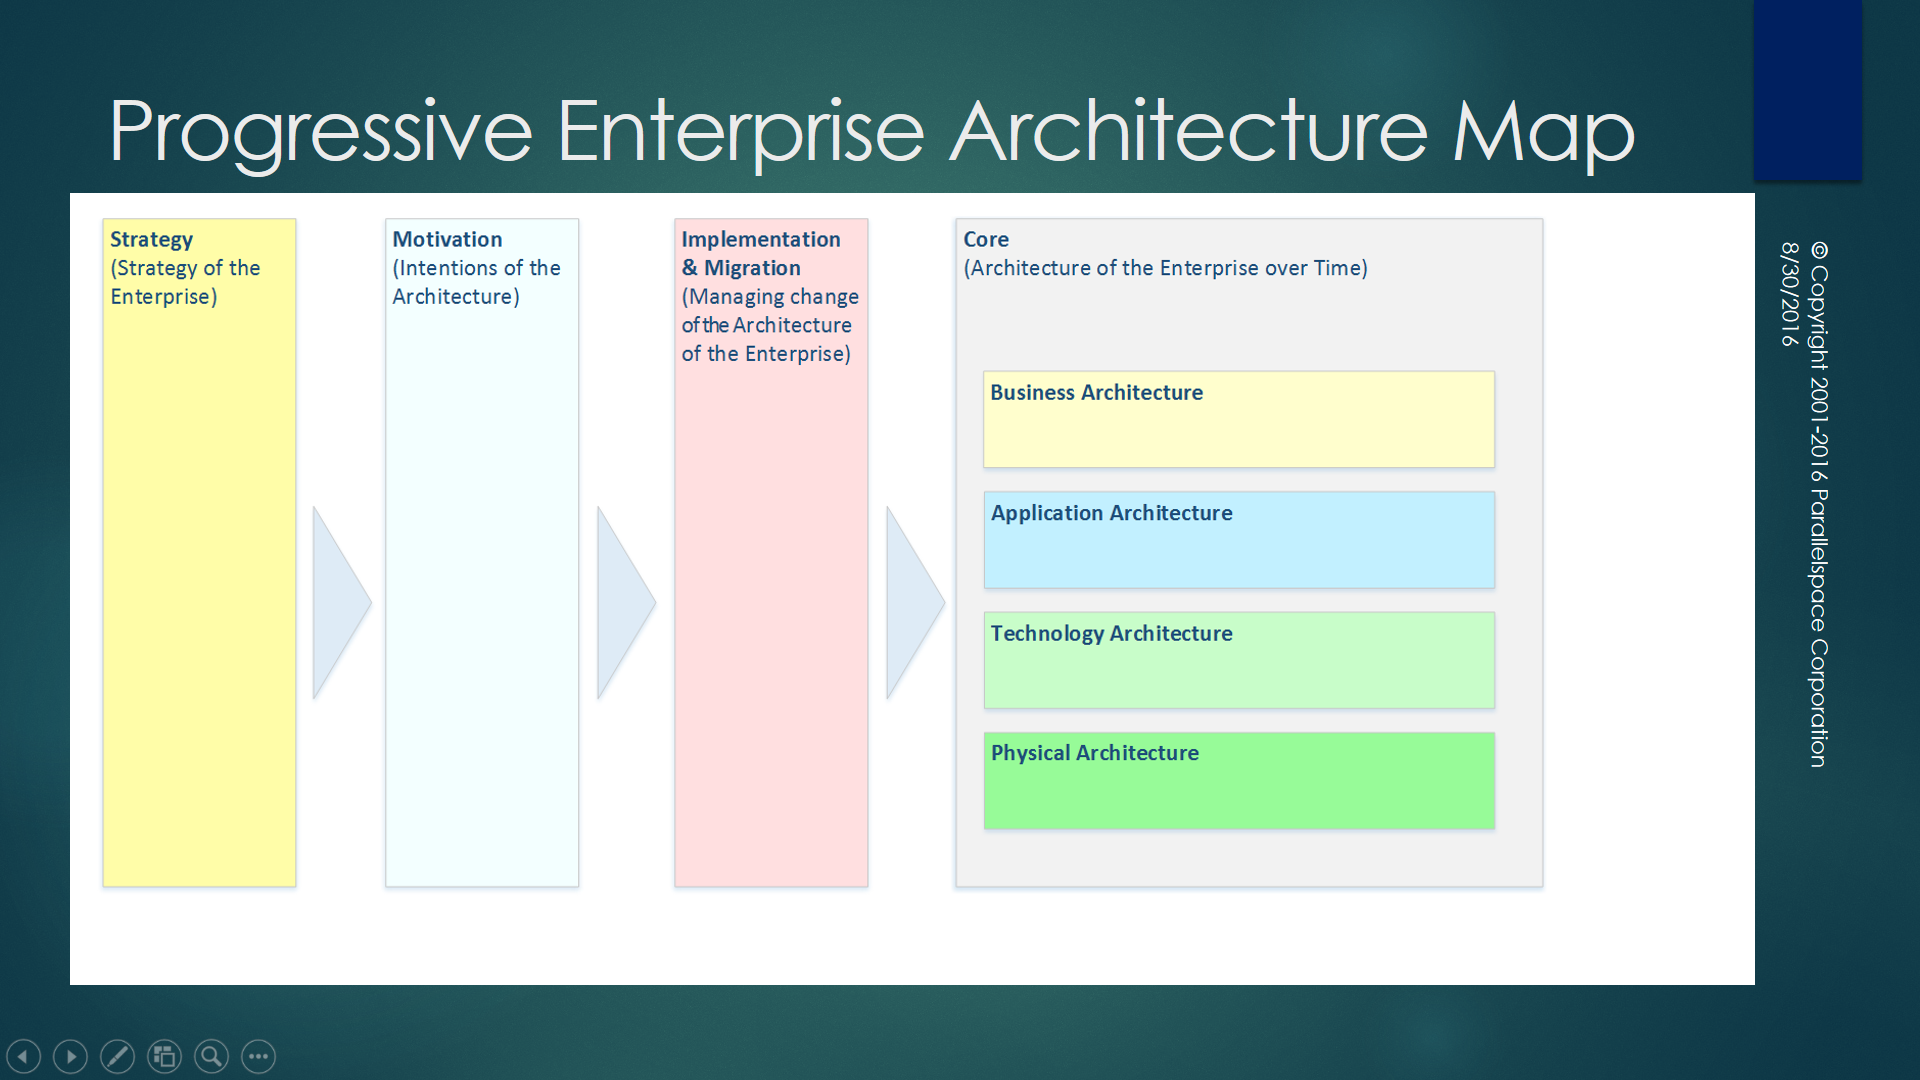
Figure 1. Progressive Enterprise Architecture Model

Continuous Transformation Framework

The Continuous Transformation Framework is a Deming Cycle based on the following 4 phases:

  1. Listening & Learning
  2. Knowledge > New Designs
  3. Plan & Act
  4. Transformative Change > New Outcomes

The Framework is depicted as a continuous cycle as shown in Figure 1 above. The Framework can also be flattened and presented as a (repeating) sequence of 4 processes (Figure 2).

peam-continuous-transformation

Figure 2. Continuous Transformation Framework

Why all of this discussion about PEAM and the Continuous Transformation Framework? It is because to be able to understand and value the ModelMate Architecture Reference Model, it’s important to understand the class of problems it is trying to solve. Automated support for Continuous Transformation is the pain; ModelMate is the pain killer.

ModelMate Architecture Reference Model

There are 3 high-level layers in the ModelMate Architecture Reference Model:

  • Apps that use the ModelMate repository
  • Continuous Transformation Framework
  • ModelMate Open Hybrid Repository (MOHR)

These 3 layers (and 4 categories of apps) are illustrated in Figure 3.  Each app category corresponds to one phase in the Continuous Transformation Framework.

marm-modelmate-open-hybrid-repository-app-categories

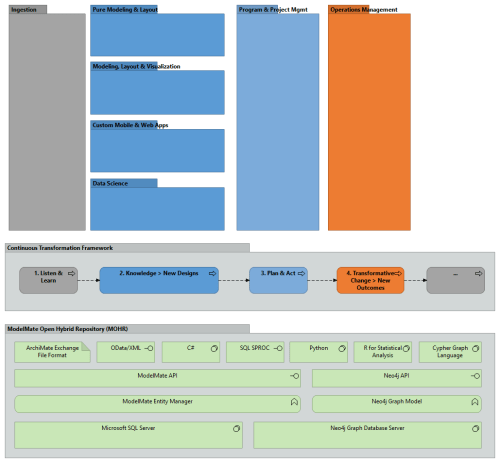
Figure 3. ModelMate Architecture Reference Model: 3 Layers

The choice of apps that your organization selects for each category depends on the medium-term and long-term drivers and goals for your enterprise architecture program. The app groups map to specific phases of the Framework:

  1. Listen & Learn phase
    • Ingestion
  2. Knowledge > New Designs phase
    • Pure Modeling and Layout apps
    • Modeling, Layout & Visualization apps
    • Data Science apps
    • Custom Mobile and Web apps
  3. Plan & Act phase
    • Program & Project Management apps
  4. Transformative Change > New Outcomes phase
    • Operations and Change Management apps

Figure 4 lists a sample or representative list of applications that can fulfill the needs of each app category (each phase of the Continuous Transformation Framework).

marm-modelmate-open-hybrid-repository-apps

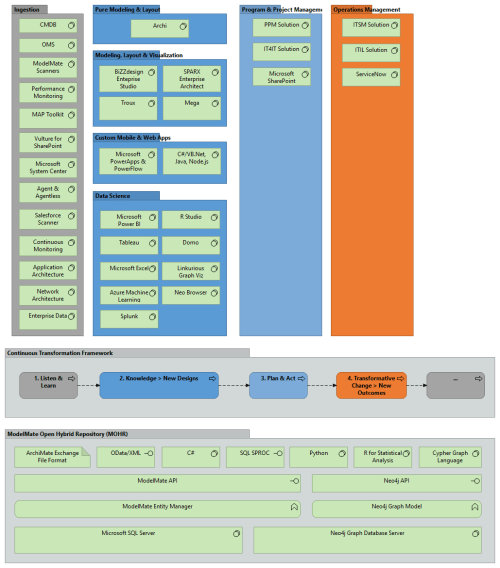
Figure 4. ModelMate Architecture Reference Model: Apps

Ingestion

Ingestion apps are responsible for scanning the enterprise’s operational environment: systems, assets, and processes. Information captured about each entity includes its structure, metadata, performance and usage data.  Operational business data is usually not needed and not captured.

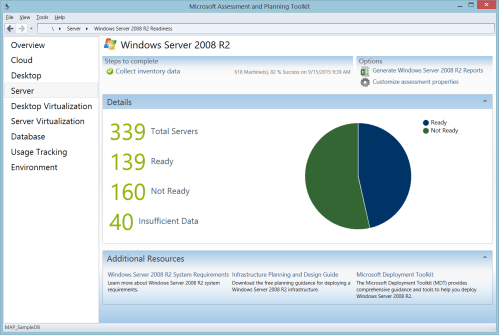
Sources of data include business process logs, configuration management databases, LOB application configurations (SAP, SharePoint, Salesforce, Microsoft Dynamics CRM, Oracle Financials, etc.), operations management systems (Azure OMS, Microsoft System Center, etc.), Microsoft MAP Toolkit, performance monitoring logs, usage and audit logs, etc.

These are inbound data sources used to automatically update and maintain the EA models stored in ModelMate. Ingestion apps are the primary data sources for the Listen & Learn phase of the Continuous Transformation Framework.

Pure Modeling and Layout Apps

There are several types of apps that comprise the Knowledge > New Designs phase of the Framework.  Pure Modeling and Layout Apps are applications that support the manual modeling of entities, relationships, and metadata as well as the manual layout of stakeholder specific views.

The apps in the group do not support any built-in analysis and visualization capabilities beyond manually-created basic views. In addition, pure modeling and layout apps do not include an end-user scripting capability for performing automated, user-defined custom analysis or visualization.

Archi is an example of a pure modeling and layout app.

Modeling, Layout & Visualization Apps

These types of apps support manual modeling of entities, relationships and metadata and the manual layout of stakeholder specific views but also include basic, advanced, and/or custom analysis and visualization capabilities.

BiZZdesign Enterprise Studio and other advanced EA modelers are examples of apps that belong to the Modeling, Layout & Visual Apps group – supporting the needs of the Knowledge > New Designs phase of the Framework.

Data Science Apps

Data Science Apps include non-traditional “enterprise architecture” modeling and analysis apps. This group includes both open sources as well as COTS (commercial off the shelf) data science tools and platforms. Data Science apps provide advanced analysis, machine learning and visualization capabilities enabled through open access to enterprise architecture data via standard protocols and APIs (e.g.ArchiMate Exchange File Format, OData, SQL Server stored procedures, entity models, and advanced query and analysis languages such as R, Cypher, and T-SQL).

Examples of Data Science apps include: R Studio, Microsoft Power BI, Tableau, Domo, Linkurious, Microsoft Excel and the Neo4j graph browser.

Custom Mobile and Web Apps

This is the last group of apps that support the Knowledge > New Designs phase of the Framework and includes both no-code and code platforms for creating custom reporting, analysis, visualization apps.

No-code custom apps designed with Microsoft PowerApps (and Microsoft PowerFlow) are examples of the former; traditional C#/VB.Net, Java, and Node.js/JavaScript apps are examples of the latter.

Program & Project Management Apps

Program & Project Management Apps support the Plan & Act phase of the Framework.

Traditional portfolio, program, and project managements apps are examples of applications in this group. Collaboration tools such as Microsoft SharePoint, Confluence, and Jira can also belong in this group. Collaboration tools can also be considered as “horizontal” solutions that can be used across all phases of the Framework.

Operations and Change Management Apps

All of the effort to create and manage a functioning enterprise architecture solution only realizes direct business value when it leads to Transformative Changes being made in the enterprise’s strategies, systems, assets, and processes; and measurable, positive New Outcomes result from the changes.

Examples of apps in this category include change management applications that support IT Service Management (ITSM) disciplines such as ITIL. ServiceNow is an example of an ITSM app.

Please provide your feedback in the Comments section below or feel free to email me directly.

Best regards,
Michael Herman (Toronto)
Parallelspace Corporation
mwherman@parallelspace.net

*ArchiMate is a registered trademark of The Open Group.

All other trademarks, servicemarks, registered trademarks, and registered servicemarks are the property of their respective owners.

4 Comments

Filed under ArchiMate, Automated Application Architecture Analysis, Automated Enterprise Architecture Modeling, Business Value, continuous transformation, Crossing the EA Charm, Data Science, ModelMate, Power BI, Progressive Enterprise Architecture Map (PEAM), Salesforce, SharePoint

Crossing the EA Chasm: “Where does IoT [Internet of Things] fit in?”

In the article The EA Chasm: Open Repository Strategies for Enterprise Architecture, Vijay Sharma asked the question: “Where does IoT [Internet of Things] fit in?”. Vijay, you couldn’t have chosen a more perfect example or a better question.

The one-word answer is “everywhere” – no sarcasm intended.

The “1000 word” answer can be found in the following diagram based on the Progressive Enterprise Architect Map (PEAM) model (click to enlarge):

Progressive EA Model 1-0-7-PEAMS-Chasms-IoT.png

The first thing that strikes me about this diagram is: with the need to complete 15+ major, cross-functional, interdependent activities, it is completely understandable why major digital business initiatives fail or, otherwise, “wither and die on the vine” before they’re completed.  This applies to all digital business initiatives – not just IoT.

Second, what happens when an IoT (or any other enterprise) initiative starts off as a “skunkworks” project?  Placing the question in the context of the above diagram, what if IoT starts off on the far, far right (activities 12-15) as unplanned, uncoordinated activities by a group without any defined business drivers, linkage to the business strategy, or connection to the enterprise architecture?

Food for thought (and time for breakfast).

Best regards,
Michael Herman (Toronto)
Parallelspace Corporation

p.s. Why was activity 16 (IoT Platforms and Tools) placed inside the Enterprise Architecture Chasm?

It’s mostly unrelated to the above discussion but it hints at the idea that IoT approaches can also be used in a non-traditional way to Listen to signals in the  Enterprise Assets, Systems, and Processes (performance data, usage information, planned and unplanned changes in the operational processes and systems, etc.), and then use this data to annotate the Core Enterprise Architecture. BI techniques can be used to analyse and visualize the annotated EA model to create new Designs.  The coordination of the building and  deployment of the new Designs hopefully results in Transformative Changes being applied to the Enterprise’s Strategies, Systems, Assets, and Processes to produce additional, meaningful business value.

IoT Platforms and Tools are enablers for listening and responding to the “hum” of an organization’s systems, assets and processes, and, when fully realized, can also be used to distribute Transformative Changes in a software-defined enterprise.

To read more about using IoT to create, maintain and manage an enterprise architecture, check out External IoT vs. Internal IoT: Beware of the Hype Cycle.

1 Comment

Filed under ArchiMate, Architecture Reference Models, Crossing the EA Charm, Enterprise Architecture, ModelMate, Progressive Enterprise Architecture Map (PEAM)

Using ArchiMate 2.1 to Model Product or Service Markets

In the LinkedIn ArchiMate group, Toon Wijnands posted a query asking

I’m looking for the concept of modelling ‘Market’. I’m referring to the markets a company is active at. e.g. you could have a B2C market and a B2B market, or USA market, European market, Asian market.
[Any suggestions on how to model the concept ‘Market’ in ArchiMate?]

My response was:

Michael Herman (Toronto) I recommend using a Location to represent a Market and to aggregate the concepts that are relevant to each market and to your model’s goals. This includes using Location as an abstraction for specific B2B and B2C markets – making sure to document this practice in your EA governance document.

The aggregated concepts can [be] nested within each Location as a mini-model. Each mini-model can include Stakeholders (including specific or representative, customers, government entities, other regulatory bodies, competitors, etc), as well as Constraints and Requirements imposed by the preceding Stakeholders, etc. The market-specific set of Constraints and Requirements can then be linked to a possibly smaller, more uniform set of Drivers.

Ownership and updating of the Market mini-models, singly or in total, can be given to a member of your EA team or a business client within your organization. Elaborate Market models can be licensed or sold – but I’m getting off topic.

As a follow-up, here’s a concrete example using ArchiMate 2.1 and the Archi modeling tool; including the exact steps I followed to create a Market mini-model.

Start at the top: Most Markets are defined by their Stakeholders: Customers (or their Personas), Competitors, and Government Agencies (and perhaps, other regulatory or standards bodies). Use these to drive out a selected set of Drivers and Goals for your next product release. Of course, the current state of your Market model doesn’t have to respond to every Stakeholder or Driver.  Include all of these in the model but, in the current state of the model, only include the Goals you are trying to satisfy in the next release. From the Goals, derive more specific product or service Requirements.

In addition, add a Market Research Team as a Stakeholder to document specific market analyses or Assessments as part of your mini-model; linking these to a new or existing set of Goals.

You’ll end up with something like the following. Click to enlarge.

Markets 0

Of course, the current state of your Market mini-model doesn’t have to respond to every Stakeholder or Driver.  Include all of these in the model but, in the current state of the model, only include the Goals you are trying to satisfy in the next release. From the Goals, derive more specific product or service Requirements.

TIP: Because of the way ArchiMate works, make sure each Driver, Goal, Assessment, Requirement, etc. is linking to a Stakeholder; hence, the reason for creating the Market Research Team stakeholder.

TIP: Consider creating 3 views (I call them Construction Views) to help you track your work. In my model, I called them Markets 0, Markets 1, and Markets 2.  The above view is Markets 0.

Then select all of the elements of your Market mini-model, and drag and drop them onto a Location element (named Market M in the above example) to get the second version (view) of the model.

TIP: Different ArchImate modeling tools handle this action in different ways. In my example, Archi prompts you to add Assignment relations to relate each of the 5 Stakeholders to the Market M location element. I’ll talk more about this later.

…and voila!, here is one example of a Market mini-model.  Use the same technique to create mini-models for your additional markets. Click to enlarge.

Markets 1

What’s going on behind the scene views?

To understand how ArchiMate (and Archi) chose to model this scenario, after you’ve dragged and dropped your mini-model onto the Location element and accepted the creation of the new Assignment relations, do the reverse: select all of the mini-model elements nested inside the Location and drag and drop them outside of the Market M location element.  Your (third) view should look something like the following. Click to enlarge.

Markets 2

The Market M Location element is related to each Stakeholder using the automatically created Assignment relations.  The rest of the mini-model is related to the Location element via Derivation. This is why it was important to have the Assessment, Driver, Goal, Requirements, etc. elements related to a Stakeholder.

Every language (conventional or technical) has its idiosyncracies. Use ArchiMate and make it work in a way what works best for you and your organization.

Best regards,
Michael Herman (Toronto)

p.s. Please add your feedback in the Comments section below.  How can this idea be improved?

4 Comments

Filed under ArchiMate, Architecture Reference Models, Enterprise Architecture, Product Management, The Open Group

Crossing the Chasm: Progressive​ Enterprise Architecture Model (PEAM)

[Updated October 5, 2016]

Inspired by Gerben Wierda’s thoughtful discussion about how the full framework is depicted in the new ArchiMate* 3.0 specification (An AchiMate 3 Map (Layers? What Layers! — 1)), I’m going to suggest there’s another level of improvement that can be made to the specification’s “peanut butter and jelly sandwich” diagram. [Please excuse the visual metaphor but that’s what it looks like – with PB&J leaking out on all sides.]

image004

Figure 1. ArchiMate 3 Layers and Aspects

In his posting, Gerben suggests a succession of improvements (depicted below).

This slideshow requires JavaScript.

Figure 2. Gerben Wierda’s Suggested Improvements

But they still left my question unanswered: Why were Strategy, Motivation, Implementation & Migration left as disconnected layers on opposite sides of the enterprise architecture map? [I don’t accept Motivation being classed as an Aspect but that’s a topic for another article.]

What happened to the architectural principles of simplicity and elegance?

Aren’t the following series of enterprise architecture maps more informative and more understandable?  …more pragmatically useful?  I refer to the version below as the Progressive Enterprise Architecture Map.

Progressive EA Model 1-0-2-Base-Slide

Progressive EA Model 1-0-2-Layers-Slide

Progressive EA Model 1-0-2-Aspects-Slide

Progressive EA Model 1-0-2-Both-Slide

Figure 3. Progressive Enterprise Architecture Model: Progressive Enterprise Architecture Map

Check them out for yourself and please add your feedback in the Comments section below. Click on any diagram to see a larger version.

Best regards,
Michael Herman (Toronto)

p.s. If the arrows make the enterprise architecture map too prescriptive from a pure ArchiMate specification perspective, what do you think of this version?

Progressive EA Model 1-0-3-NoArrows-Slide

p.p.s. In October 2016, in the article Crossing the Enterprise Architecture Chasm, I extended PEAMs to include:

  • Continuous Transformations
  • Strategy Chasm
  • Enterprise Architecture Chasm

Here’s an example (click to enlarge):

progressive-ea-model-1-0-6-peam3-chasms

*ArchiMate is a registered trademark of The Open Group.

6 Comments

Filed under ArchiMate, Architecture Reference Models, Automated Application Architecture Analysis, Crossing the EA Charm, Enterprise Architecture, Progressive Enterprise Architecture Map (PEAM), The Open Group

Parallelspace PowerPoint Template for ArchiMate 2.1

[Scroll down to see an experimental version of the PowerPoint template for modeling Conceptual, Logical and Physical architectures using ArchiMate symbols.]

Standard PowerPoint Template

Click here to open or download a copy of my Parallelspace PowerPoint Template for ArchiMate 2.1 version 1.1 (file version 1-0-12).  For Microsoft Office, there are Visio templates for ArchiMate but I’m not aware of there being any PowerPoint templates. See below for an example.

Please post your feedback in the comments …good or otherwise.  Please let me know what you think and, more importantly, how are these helping you and what you would like to see next?

Enjoy.

This slideshow requires JavaScript.

Here’s a simple PPT use case/example:

Parallelspace ArchiMate Concepts 1-0-12-Example

Experimental PowerPoint Template (Conceptual, Logical and Physical Architecture Modeling)

Click here to open or download a copy of an experimental version of my Parallelspace PowerPoint Template for ArchiMate 2.1 version 2.0 (file version 1-0-14) containing experimental conceptual, logical and physical renderings of the ArchiMate Business Architecture, Application Architecture and Physical Architecture concepts.

This slideshow requires JavaScript.

Best regards,
Michael Herman (Toronto)

*ArchiMate is a registered trademark of The Open Group.

1 Comment

Filed under ArchiMate, Enterprise Architecture, The Open Group

[Enterprise Architecture, Big Data, CRM, ERP, …] Tools and Methods Don’t Generate Business Value

[Updated: April 23, 2017]

Enterprise architecture and other tools and methods don’t generate business value – plain and simple; at least, not direct business value. This applies to many categories of enterprise software including but not limited to:

  • business intelligence
  • big data
  • enterprise analytics
  • CRM
  • ERP, etc.

It’s true. You don’t have to think about. You disagree? …or otherwise, want proof? Read on…

Read on…

At best, these tools and methods can enable or aid in the creation of increased business value.  This is actually pretty simple (in hindsight).

Real business value is only realized when an organization’s operational strategies, systems, assets, and processes experience measurable, positive Transformative Change – whether enabled by the use of a particular tool or method; or not.

Here’s the diagram… (click on any of these figures to enlarge them)

Parallelspace-Business Value from Transformative Change1

Figure 1. Enterprise Architecture Management

Here is some additional information on the ModelMate Continuous Transformation Framework as well as where and how business value is created.

Parallelspace-Business Value from Transformative Change2.png

Figure 2a. Continuous Transformation Framework

Parallelspace-Business Value from Transformative Change3.png

Figure 2b. Continuous Transformation Framework

Parallelspace-Business Value from Transformative Change4

Figure 2c. Continuous Transformation Framework

Here’s a more recent elaboration on the Continuous Transformation Framework described above.

progressive-ea-model-1-0-9-peam3-ea-chasm-auto-dots

Figure 3. Continuous Transformation Framework (updated)

The articles below go further to identify and define the gap that exists between the enterprise architecture reference model for the organization and the organization’s operational systems, assets and processes as the Enterprise Architecture Chasm. (Similarly, there is a gap between the strategy and reality is called the Strategy Chasm).

Related Articles

Best regards,
Michael Herman (Toronto)
mwherman@parallelspace.net

6 Comments

Filed under Business Value, Enterprise Architecture

Enterprise IoT and Total Enterprise Architecture Awesome Scenario #2: Microsoft MAP Toolkit

[Caveat: The Microsoft Assessment and Planning (MAP) Toolkit strictly speaking does not use any of the Azure services that support the Microsoft Azure IoT Suite.  That being said the MAP Toolkit is a great example of what the analysis experience might be like.  Maybe some day there will be a direct pipe from Azure Event Hubs/Stream Analytics/Data Factory and the MAP Toolkit discovery, logging and tracking capabilities.]

Previously I highlighted that one of the Delve Analytics videos was a great example of what an Enterprise IoT experience might look like.  In this post, I’m highlighting a second example: The Microsoft Assessment and Planning (MAP) Toolkit.

Here is some what dated overview video but check it out just the same.  You’ll certainly get the idea.

Lastly, here’s a second screen shot from the MAP Toolkit sample database – the one the results from drilling down to learn more about your organization’s Windows Server 2008 R2 deployment/upgrade readiness.

MAP 1

Michael Herman (Toronto)


Leave a comment

Filed under IoT, Parallelspace TDM

Enterprise IoT and Total Enterprise Architecture Awesome Scenario #1: Delve Analytics

[Caveat: Delve Analytics (and the Microsoft Office Graph) strictly speaking do not use any of the Azure services that support the Microsoft Azure IoT Suite.  That being said Delve Analytics is a great example of what the analysis experience might be like.  Maybe some day there will be a direct pipe from Azure Event Hubs/Stream Analytics/Data Factory into the Office Graph.  Given this crosses product group boundaries, I wouldn’t expect this to come about any time soon.]

Today, I ran across this 9 minute video with Ryan Fuller about a new Office Graph capability called Delve Analytics.

This video is an absolutely great example of the Enterprise IoT landscape I talked about in my article from a couple days ago: External IoT vs. Internal IoT: Beware of the Hype Cycle.  … an absolutely perfect example.

Here’s a link to the YouTube video Introducing Delve Analytics in Office 365 (April 6, 2016).

Watch it …it’s only 9 minutes.

Michael Herman (Toronto)

1 Comment

Filed under IoT, Parallelspace TDM