Crossing the EA Chasm: Enterprise Architecture Diagrams Your Grandmother (and CIO) Will Love

[Updated October 13, 2016]

PLEASE POST A COMMENT ABOUT WHY THIS PAGE IS IMPORTANT TO YOU.
This particular page is 1 of my top 5 most viewed pages (ever) and I’d like to understand why. Thank you!

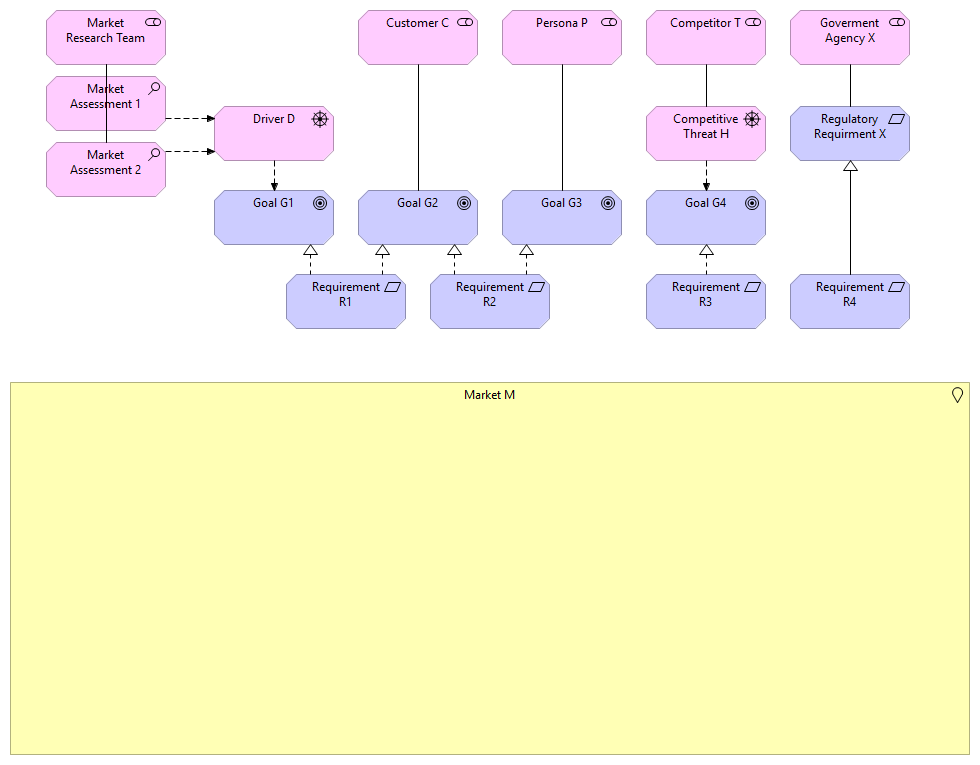
Let’s face it – not everyone is in love with the traditional enterprise architecture diagrams that are based on the ArchiMate* standard. Here, more or less, is a typical ArchiMate view.

modelmateeff1

Figure 1. A Traditional ArchiMate View: VetContext ModelMate Model

What if there was a way to create literally any type of visualization you wanted – from a common, central, “single version of the truth” repository?  Something your grandmother (and CIO) will love?

The first step is to unlock your enterprise architecture data.

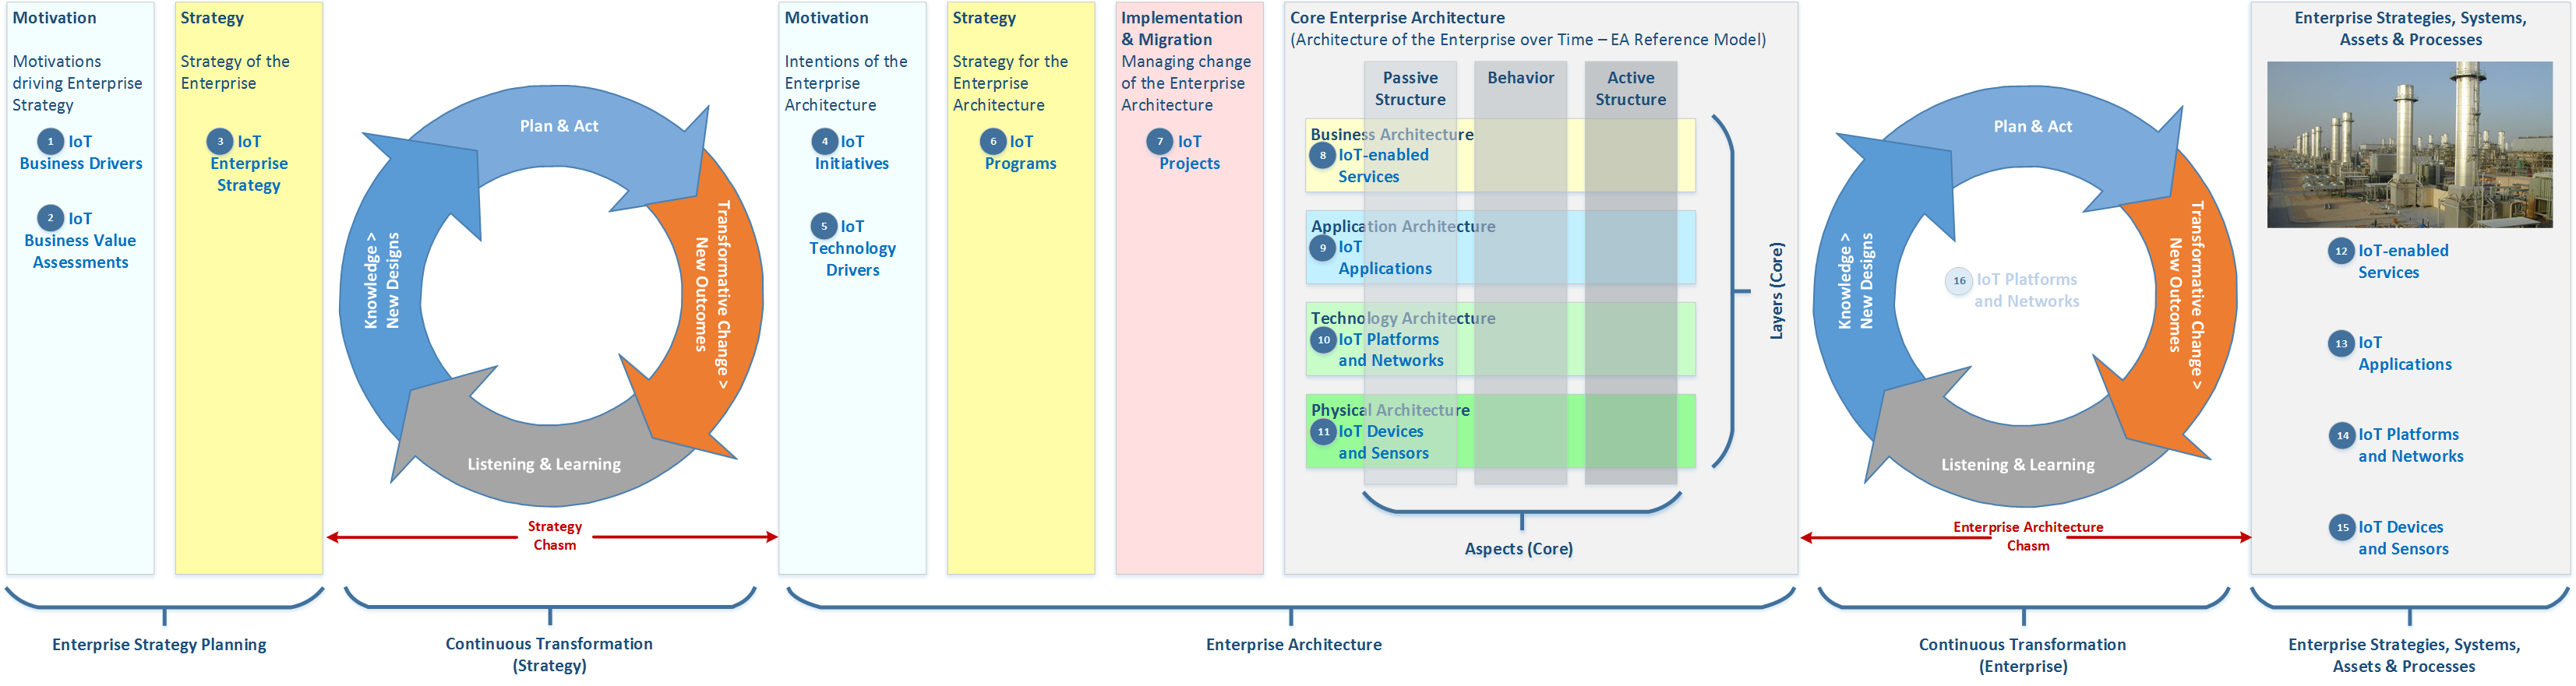
In the recent article Crossing the EA Chasm: Open Repository Strategies for Enterprise Architecture, I described an open data access strategy for providing easy access to EA data from virtually any open source or COTS (commercial-off-the-shelf) modeling, data visualization, machine learning, or business intelligence platform.

The ModelMate project is a realization of this open repository strategy for EA data.  ModelMate supports access to a central EA repository using the following protocols:

  • The Open Group ArchiMate Model Exchange File Format (EFF) import and export
  • OASIS OData interoperability REST web API
  • .NET API for C# and VB.NET developers
  • Direct access to the underlying SQL Server repository using T-SQL stored procedures

The latest version of the ModelMate architecture is depicted below (October 12, 2016).

modelmate-integrations-1-0-6-pbix

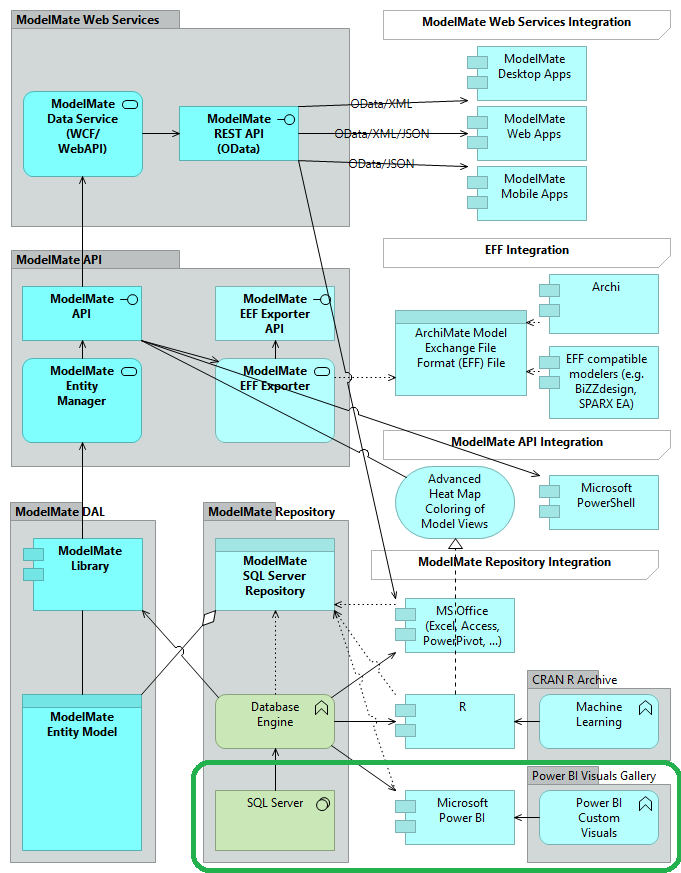
Figure 2. The Model Mate Project: Logical Architecture

What sorts of visualizations does an open repository strategy like ModelMate enable? Check out the following ModelMate Graph rendered as an interactive EA exploration tool using Microsoft Power BI, the free desktop edition. This is just one rendering – the number of possibilities is limitless.

ModelMateGraph1.png

Figure 3. VetContext ModelMate Graph rendered using Microsoft Power BI (desktop)

From Power BI Desktop, it takes a couple clicks to publish a live, interactive, web version of the model to the cloud – the same ModelMate model that was used to create Figure 1.

modelmategraph1web

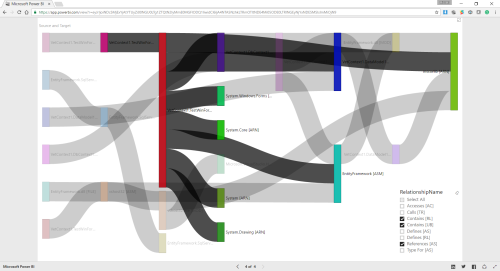
Figure 4. VetContext ModelMate Graph rendered using Microsoft Power BI (cloud)

Click here to check it out for yourself: ModelMate Graphs running in the cloud.

The above “spaghetti” visual is just one of the dozens of custom visuals available for Power PI.  Here’s a sampling….

This slideshow requires JavaScript.

Figure 4. Microsoft Power BI Custom Visual Gallery

TIP: To use Data Science platforms like Power BI and R to get the most out of your EA data, consider looking into the Microsoft Professional Degree Program in Data Science.

Please email me if you have any questions or additional comments at mwherman@parallelspace.net.

Best regards,

Michael Herman (Toronto)

Parallelspace Corporation

p.s. Don’t forget to email a copy of the link to your grandmother (or your CIO).  Please add your feedback in the Comments section below.

p.p.s. Here’s an updated view of the same VetContext ModelMate model using the latest version of SPARX Enterprise Architect version 13 that was released earlier this week. The layout was created using the Digraph automated layout feature.  When you have a powerful and easy way to scan and ingest arbitrary sized datasets, features like automated layout and routing become critically important.

vetcontext-logical-architecture-1-0-6

Figure 5. VetContext ModelMate Model in SPARX Enterprise Architect 13

* ArchiMate is a registered trademark of The Open Group

3 Comments

Filed under Crossing the EA Charm, Enterprise Architecture, Microsoft Azure, ModelMate, Power BI, The Open Group

Crossing the EA Chasm: “Where does IoT [Internet of Things] fit in?”

In the article The EA Chasm: Open Repository Strategies for Enterprise Architecture, Vijay Sharma asked the question: “Where does IoT [Internet of Things] fit in?”. Vijay, you couldn’t have chosen a more perfect example or a better question.

The one-word answer is “everywhere” – no sarcasm intended.

The “1000 word” answer can be found in the following diagram based on the Progressive Enterprise Architect Map (PEAM) model (click to enlarge):

Progressive EA Model 1-0-7-PEAMS-Chasms-IoT.png

The first thing that strikes me about this diagram is: with the need to complete 15+ major, cross-functional, interdependent activities, it is completely understandable why major digital business initiatives fail or, otherwise, “wither and die on the vine” before they’re completed.  This applies to all digital business initiatives – not just IoT.

Second, what happens when an IoT (or any other enterprise) initiative starts off as a “skunkworks” project?  Placing the question in the context of the above diagram, what if IoT starts off on the far, far right (activities 12-15) as unplanned, uncoordinated activities by a group without any defined business drivers, linkage to the business strategy, or connection to the enterprise architecture?

Food for thought (and time for breakfast).

Best regards,
Michael Herman (Toronto)
Parallelspace Corporation

p.s. Why was activity 16 (IoT Platforms and Tools) placed inside the Enterprise Architecture Chasm?

It’s mostly unrelated to the above discussion but it hints at the idea that IoT approaches can also be used in a non-traditional way to Listen to signals in the  Enterprise Assets, Systems, and Processes (performance data, usage information, planned and unplanned changes in the operational processes and systems, etc.), and then use this data to annotate the Core Enterprise Architecture. BI techniques can be used to analyse and visualize the annotated EA model to create new Designs.  The coordination of the building and  deployment of the new Designs hopefully results in Transformative Changes being applied to the Enterprise’s Strategies, Systems, Assets, and Processes to produce additional, meaningful business value.

IoT Platforms and Tools are enablers for listening and responding to the “hum” of an organization’s systems, assets and processes, and, when fully realized, can also be used to distribute Transformative Changes in a software-defined enterprise.

To read more about using IoT to create, maintain and manage an enterprise architecture, check out External IoT vs. Internal IoT: Beware of the Hype Cycle.

1 Comment

Filed under ArchiMate, Architecture Reference Models, Crossing the EA Charm, Enterprise Architecture, ModelMate, Progressive Enterprise Architecture Map (PEAM)

Crossing the EA Chasm: Open Repository Strategies for Enterprise Architecture

[Updated October 27, 2016]

In a recent posting (Crossing the Enterprise Architecture Chasm), I offered a definition for the term Enterprise Architecture Chasm, the practical gap that will always exist between enterprise architecture and an organization’s systems, strategies, assets, and processes (and the companion Strategy Chasm that exists between an organization’s motivation and strategy and its enterprise architecture).

progressive-ea-model-1-0-6-peam3-chasms

Figure 1. Progressive Enterprise Architecture Map

In this posting, I describe the “ModelMate” project – the creation of an open EA repository software solution that assists in crossing the EA Chasm. “ModelMate” is a codename for this project (also read the p.s. at the bottom of this posting). Caveat: This posting will be somewhat technical but regardless of who you  are, you’ll find the example use cases to be insightful.

Definition

ModelMate is a working implementation of a Microsoft SQL Server and Neo4j graph database-based repository for managing arbitrarily large collections of arbitrary entities, properties, relationships, views, etc.to enable analysis, visualization, and understanding using easily-available open source and COTS (commercial off the shelf) business intelligence (BI), data visualization, and machine learning (ML) platforms, tools and cloud services.

Architecture

The ModelMate schema is modeled more or less after The Open Group ArchiMate Model File Exchange File Format (EFF) with several extensions; including support for multi-tenancy, 2D and 3D entities, 3D views of 2D and 3D entities, processing history, versioning, annotations (including usage and performance data), automated heat maps, replication and synchronization. Read/write access to the repository is supported using an entity-based .NET API.  Importing and exporting of EFF files is fully supported. The physical repository is a highly normalized SQL Server database. Here is what the high-level ModelMate architecture looks like.

ModeMate-HL-Architecture.png

Figure 2. Use Case 1. Cloud migration of custom .NET desktop apps, services, and web applications

ModelMate can run anywhere: on your laptop, Windows server, virtual server, data center, or in the cloud; anywhere you can use SQL Server Express, SQL Server, or Azure SQL Server.

Use Case 1: Cloud migration of custom .NET desktop apps, services, and web applications

In this scenario, a .NET Entity Discovery component scans the compiled .NET executables (.EXE files) and library assemblies (.DLL files); calling the ModelMate API to create a model in the ModelMate repository.  A separate component uses the EFF Exporter capability to read the ModelMate model and create an EFF file containing the model data.  In this specific scenario, Archi was used to read the ModelMate model and support real-time exploration of the .NET application’s architecture. At this point in the project, views are being created manually but highly facilitated by the design of the model and Archi’s Visualizer and Navigation features.  Here’s a sample of a view created from the resulting ModelMate model as well as a screenshot of what the actual dual-screen user experience looks like.

This slideshow requires JavaScript.

Figure 3. VetContext ModelMate Model imported into Archi

The broader use case is system analysis and assessment to support migration of on-premise custom .NET desktop, service and web applications to the cloud.

The above model is large; containing:

  • 190,000 properties and values
  • 25,000 labels
  • 16,000 relationships
  • 8,700 elements

The EFF file is 52MB in size;. the resulting Archi .archimate file, 34MB in size.

Because ModelMate models are based on the EFF file format, any EFF compatible modeler such as BiZZdesign Enterprise Studio or SPARX Enterprise Architect can also be used.

This slideshow requires JavaScript.

Figure 4. VetContext ModelMate Model imported into SPARX Enterprise Architect

SPARX EA’s automated layout and routing capabilities proved to be quite valuable – especially when the burden of importing extremely large numbers of elements and relationships into any of these tools is reduced to a few mouse clicks.

Use Case 2: Support for COTS (commercial-off-the-shelf) Business Intelligence tools

Because the ModelMate Repository schema is based on the EFF format (with extensions) and is realized as a SQL Server database, it is easy to produce any myriad of visualizations and perform analysis using easily-available COTS and open source tools such as Microsoft Power BI interactive data visualization tools, and the R language for statistical computing. Detailed examples with be added to this article over the next few weeks.

modelmate-integrations

Figure 5. ModelMate Logical Architecture

Given the enormous user communities and large libraries of user-contributed data analysis, machine learning, and visualization components available for each of these platforms (as well as Power BI’s support for R), there are no limits to what you can do with a ModelMate model.

Best regards,
Michael Herman (Toronto)
Parallelspace Corporation

p.s. At this point, there are no specific plans to commercialize the ModelMate project but if you think ModelMate can help make what you’re trying to accomplish a bit easier to realize, please email me at mwherman@parallelspace.net.

* ArchiMate is a registered trademark of The Open Group

10 Comments

Filed under ArchiMate, Architecture Reference Models, Crossing the EA Charm, Definitions, Enterprise Architecture, ModelMate

Crossing the Enterprise Architecture Chasm

chasm

Enterprise Architecture Chasm

What is the Enterprise Architecture Chasm?  First, a quick Google search didn’t find any previous references to the term Enterprise Architecture Chasm, at least not in the context I’m using it.  So what am I talking about?  We need to recognize the difference, the practical gap, that will always exist between EA models, plans, and other artifacts and an enterprise’s actual strategies, systems, assets, and processes. There will always be a gap because of several factors:

  • Time to design
  • Time to plan
  • Time to act
  • Time to operate
  • Time to measure new outcomes

and, lastly, the completeness and faithfulness of transformative changes that are actually implemented relative what’s documented in the enterprise architecture.  Here’s a picture highlighting this gap, the Enterprise Architecture Chasm.

progressive-ea-model-1-0-9-peam3-ea-chasm-dots

Figure 1. Total Enterprise Architecture Model (TEAM): Enterprise Architecture Chasm

This iterative 4-step management cycle is called the Continuous Transformation Framework. At a given time, there isn’t just 1 Continuous Transformation cycle at work in an organization but there can be several, even hundreds, dependent on the size and complexity of your enterprise.

Homework Question: Which dimensions or metrics can be used to characterize or benchmark the size of the Enterprise Chasm in an organization?

Strategy Chasm

Is the EA Chasm the only chasm?  No.  In most organizations, there is most likely a Strategy Chasm as well – the gap between the organization’s motivations and strategies and what is represented and planned for in the enterprise architecture.  Same set of issues.  They just occur earlier in the process.  Here’s an example of the Strategy Chasm. (Click to enlarge this diagram.)

progressive-ea-model-1-0-6-peam3-chasms

Figure 2. Team Enterprise Architecture Model (TEAM): Strategy Chasm and Enterprise Architecture Chasm

In the Fall of 2016, two webinars were presented that looked how to extend traditional enterprise architecture methods (e.g. TOGAF) to be more complete/fill in some gaps.  The first talk, 7 Reasons Why IT4IT™ is Good for Architects presented by Dan Warfield and Sven van Dijk, looked to The Open Group’s IT4IT for answers on how to cross the enterprise architecture chasm. The second talk, BIZBOK® Guide and TOGAF® Standard: Business Architecture Value Proposition presented by Chris Armstrong  and Wally McLaughlin, looked at a related set of problems from a Business Architecture and BIZBOK perspective.

To what extent are your EA methods, repositories, and tools helping your organization cross the Strategy Chasm and the EA Chasm?

Will IT4IT and BIZBOK and other methods (e.g. ITIL) help cross or close the gap?

“Time will tell…”

Best regards,
Michael Herman (Toronto)
Parallelspace Corporation

p.s. These diagrams on based on the Progressive Enterprise Architecture Model described here.

13 Comments

Filed under ArchiMate, Architecture Reference Models, continuous transformation, Crossing the EA Charm, Digital Transformation, Enterprise Architecture, Enterprise Architecture Chasm, IoT, ModelMate

ArchiMate 3.0: What is the preferred way to model a Server Farm?

For the ArchiMate 3.0 experts: What is the preferred way to model a Server Farm given some of the new elements in ArchiMate 3.0?

In ArchiMate 2.1, a collection of nested Nodes was the most obvious solution.  What is the preferred approach using ArchiMate 3.0 to model Server Farms given a) Grouping is now a (an almost) first-class concept, and b) the new Technology Collaboration element. What is the best choice?

Here’s 2 examples: Server Farm A using Grouping and Server Farm B using a Technology Collaboration element.  I’ve used slightly different scenarios for each example but my assumption (hope) is that is shouldn’t make any difference.

Server Farm A using Grouping

server-farm-a-grouping

Server Farm B using a Technology Collaboration element

server-farm-b-technology-collaboration

What is the preferred way to model a Server Farm given the new elements in ArchiMate 3.0? a) Grouping, or b) the new Technology Collaboration element.  …or something else?  What are the pros and cons of your choice?

Add your answer to the Comments section.

Best regards,
Michael Herman (Toronto)
Parallelspace Corporation
mwherman@parallelspace.net

p.s. Below is a model for Server Farm C – using the Node aggregation approach we used with ArchiMate 2.1.

server-farm-c-node-aggregation

4 Comments

Filed under Uncategorized

Using ArchiMate 2.1 to Model Product or Service Markets

In the LinkedIn ArchiMate group, Toon Wijnands posted a query asking

I’m looking for the concept of modelling ‘Market’. I’m referring to the markets a company is active at. e.g. you could have a B2C market and a B2B market, or USA market, European market, Asian market.
[Any suggestions on how to model the concept ‘Market’ in ArchiMate?]

My response was:

Michael Herman (Toronto) I recommend using a Location to represent a Market and to aggregate the concepts that are relevant to each market and to your model’s goals. This includes using Location as an abstraction for specific B2B and B2C markets – making sure to document this practice in your EA governance document.

The aggregated concepts can [be] nested within each Location as a mini-model. Each mini-model can include Stakeholders (including specific or representative, customers, government entities, other regulatory bodies, competitors, etc), as well as Constraints and Requirements imposed by the preceding Stakeholders, etc. The market-specific set of Constraints and Requirements can then be linked to a possibly smaller, more uniform set of Drivers.

Ownership and updating of the Market mini-models, singly or in total, can be given to a member of your EA team or a business client within your organization. Elaborate Market models can be licensed or sold – but I’m getting off topic.

As a follow-up, here’s a concrete example using ArchiMate 2.1 and the Archi modeling tool; including the exact steps I followed to create a Market mini-model.

Start at the top: Most Markets are defined by their Stakeholders: Customers (or their Personas), Competitors, and Government Agencies (and perhaps, other regulatory or standards bodies). Use these to drive out a selected set of Drivers and Goals for your next product release. Of course, the current state of your Market model doesn’t have to respond to every Stakeholder or Driver.  Include all of these in the model but, in the current state of the model, only include the Goals you are trying to satisfy in the next release. From the Goals, derive more specific product or service Requirements.

In addition, add a Market Research Team as a Stakeholder to document specific market analyses or Assessments as part of your mini-model; linking these to a new or existing set of Goals.

You’ll end up with something like the following. Click to enlarge.

Markets 0

Of course, the current state of your Market mini-model doesn’t have to respond to every Stakeholder or Driver.  Include all of these in the model but, in the current state of the model, only include the Goals you are trying to satisfy in the next release. From the Goals, derive more specific product or service Requirements.

TIP: Because of the way ArchiMate works, make sure each Driver, Goal, Assessment, Requirement, etc. is linking to a Stakeholder; hence, the reason for creating the Market Research Team stakeholder.

TIP: Consider creating 3 views (I call them Construction Views) to help you track your work. In my model, I called them Markets 0, Markets 1, and Markets 2.  The above view is Markets 0.

Then select all of the elements of your Market mini-model, and drag and drop them onto a Location element (named Market M in the above example) to get the second version (view) of the model.

TIP: Different ArchImate modeling tools handle this action in different ways. In my example, Archi prompts you to add Assignment relations to relate each of the 5 Stakeholders to the Market M location element. I’ll talk more about this later.

…and voila!, here is one example of a Market mini-model.  Use the same technique to create mini-models for your additional markets. Click to enlarge.

Markets 1

What’s going on behind the scene views?

To understand how ArchiMate (and Archi) chose to model this scenario, after you’ve dragged and dropped your mini-model onto the Location element and accepted the creation of the new Assignment relations, do the reverse: select all of the mini-model elements nested inside the Location and drag and drop them outside of the Market M location element.  Your (third) view should look something like the following. Click to enlarge.

Markets 2

The Market M Location element is related to each Stakeholder using the automatically created Assignment relations.  The rest of the mini-model is related to the Location element via Derivation. This is why it was important to have the Assessment, Driver, Goal, Requirements, etc. elements related to a Stakeholder.

Every language (conventional or technical) has its idiosyncracies. Use ArchiMate and make it work in a way what works best for you and your organization.

Best regards,
Michael Herman (Toronto)

p.s. Please add your feedback in the Comments section below.  How can this idea be improved?

4 Comments

Filed under ArchiMate, Architecture Reference Models, Enterprise Architecture, Product Management, The Open Group

Progressive​ Enterprise Architecture Maps – Update 2

Pavel Harbe asked an interesting question with respect to the original version of the Progressive Enterprise Architecture Map: “Why … is Strategy first and then Motivation and not in opposite order (or in many iterations)?” and goes on to explain that, yes, in fact Motivation should precede Strategy (at least initially, and then followed by possibly several iterations).  Of course, Pavel is correct …but so is the diagram (see below). However, Pavel’s comments do indicate a need to clarify these points – here in text as well as in a new version of the Progressive Enterprise Architecture Map.

Progressive EA Model 1-0-3-NoArrows-Slide

*Original discussion: Progressive Enterprise Architecture Maps

To respond directly to Pavel’s question, the subtlety in the original diagram can be found in text beneath the caption of each layer (emphasis added for this explanation):

  • Strategy refers to the “Strategy of the *Enterprise*”, the organizational strategy.
  • Motivation refers to the “Intentions of the *Architecture*”, a phrase borrowed from Gerben Wierda’s original discussion (An ArchiMate 3 Map (Layers? What Layers!))

The original diagram referred to the strategy of the organization driving the motivations [intentions] for the companion enterprise architecture.

Given pragmatic usefulness is one of my goals for the Progressive Enterprise Architecture Map (while at the same time preserving architectural simplicity), the following elaboration is warranted: adding 2 more layers to clarify the levels at which Strategy and Motivation are used to drive continuous transformation of the organization and its enterprise architecture.  Here is version 2 of Progressive Enterprise Architecture Map.

Progressive EA Model 1-0-3-PEAM2-Slide

On the left side of the diagram, there is a distinct pair of Motivation and Strategy layers for enterprise-level strategy planning.  In addition, there is a distinct pair of these 2 layers which transform the enterprise-level drivers, goals, and strategies into drivers, goals, and strategies for the enterprise architecture. You can argue these should be the same but due to many reasons such as timing and resources, they are not always the same.

Progressive Enterprise Architecture Maps, Continuous Transformation, and Total Enterprise Architecture Managment

Given this elaboration, I decided to “take it all the way” and link Progressive Enterprise Architecture Maps to Continuous Transformation and Total Enterprise Architecture Managment – topics I’ve discussed and modeled in the article [Enterprise Architecture] Tools and Methods Don’t Create Business Value.  The model for Continuous Transformation and Total Enterprise Architecture Managment looks like the following:

Parallelspace-Business Value from Transformative Change4

Here’s version 3 of the Progressive Enterprise Architecture Map (linked to Continuous Transformation and Total Enterprise Architecture Management).

Progressive EA Model 1-0-3-PEAM3-Slide

Best regards,
Michael Herman (Toronto)

1 Comment

Filed under ArchiMate, Architecture Reference Models, Enterprise Architecture, Progressive Enterprise Architecture Map (PEAM)

Crossing the Chasm: Progressive​ Enterprise Architecture Model (PEAM)

[Updated October 5, 2016]

Inspired by Gerben Wierda’s thoughtful discussion about how the full framework is depicted in the new ArchiMate* 3.0 specification (An AchiMate 3 Map (Layers? What Layers! — 1)), I’m going to suggest there’s another level of improvement that can be made to the specification’s “peanut butter and jelly sandwich” diagram. [Please excuse the visual metaphor but that’s what it looks like – with PB&J leaking out on all sides.]

image004

Figure 1. ArchiMate 3 Layers and Aspects

In his posting, Gerben suggests a succession of improvements (depicted below).

This slideshow requires JavaScript.

Figure 2. Gerben Wierda’s Suggested Improvements

But they still left my question unanswered: Why were Strategy, Motivation, Implementation & Migration left as disconnected layers on opposite sides of the enterprise architecture map? [I don’t accept Motivation being classed as an Aspect but that’s a topic for another article.]

What happened to the architectural principles of simplicity and elegance?

Aren’t the following series of enterprise architecture maps more informative and more understandable?  …more pragmatically useful?  I refer to the version below as the Progressive Enterprise Architecture Map.

Progressive EA Model 1-0-2-Base-Slide

Progressive EA Model 1-0-2-Layers-Slide

Progressive EA Model 1-0-2-Aspects-Slide

Progressive EA Model 1-0-2-Both-Slide

Figure 3. Progressive Enterprise Architecture Model: Progressive Enterprise Architecture Map

Check them out for yourself and please add your feedback in the Comments section below. Click on any diagram to see a larger version.

Best regards,
Michael Herman (Toronto)

p.s. If the arrows make the enterprise architecture map too prescriptive from a pure ArchiMate specification perspective, what do you think of this version?

Progressive EA Model 1-0-3-NoArrows-Slide

p.p.s. In October 2016, in the article Crossing the Enterprise Architecture Chasm, I extended PEAMs to include:

  • Continuous Transformations
  • Strategy Chasm
  • Enterprise Architecture Chasm

Here’s an example (click to enlarge):

progressive-ea-model-1-0-6-peam3-chasms

*ArchiMate is a registered trademark of The Open Group.

6 Comments

Filed under ArchiMate, Architecture Reference Models, Automated Application Architecture Analysis, Crossing the EA Charm, Enterprise Architecture, Progressive Enterprise Architecture Map (PEAM), The Open Group

Periodic Table of Visualization Methods

periodic_table

Leave a comment

June 15, 2016 · 9:13 pm

MS Azure is a bit of a bucket of bolts …very good bolts …but relative to the other IoT vendors, a bucket of bolts.

Michael Herman: Yes, there’s lots of “stuff” but I don’t see any content that targets Architects in the same effective ways that the [other vendor] content does. MS Azure is a bit of a bucket of bolts …very good bolts …but relative to the other IoT vendors, a bucket of bolts. Where’s the equivalent of a Google map that shows me the least cost or least complexity or hyper-performant architectures for receiving events, processing them through an easily composable and implementable pipeline of post-processing steps, and then persist the results and make them available through Power BI? …without constantly having to dig through the bucket or using Web Jobs as band-aids between every pair of Azure services?

Microsoft: Michael – are these more of what you had in mind:
https://azure.microsoft.com/en-us/documentation/articles/iot-suite-remote-monitoring-sample-walkthrough/
https://azure.microsoft.com/en-us/documentation/articles/iot-suite-predictive-walkthrough/
The Azure IoT Suite preconfigured solutions are actually implementations of the IoT Suite Reference Architecture you refer to above.
Thanks for the feedback, we’re actually discussing having more of an architectural center right now internally – can you provide more information on what you’d like to see?

Michael Herman: What does Nirvana look like? An Expedia-like traveling booking experience for all of Microsoft Azure where I provide my departure point, destination(s), and all the points in between (stopovers) and Microsoft produces a series of “flight options” (detailed architectures with *diagrams* and customizable blueprint/recipe documentation) where each option is differentiated by Azure cost, complexity, and performance …just like booking a flight. I get to choose the option (aka architecture) that suits my requirements and budget. Simple 😉

1 Comment

Filed under Uncategorized